Import and fix mine layout
1. Prepare a DXF file
Download the Sample mine layout DXF file that we will be using in this tutorial. Save the file locally on your computer to your favorite location. Layouts can be exported as DXF files from many industry-standard mining tools like Micromine and Deswik.
2. Import the DXF file
Run MineTwin and open the scenario we created in the previous step. In the Map view, click the Import DXF button:
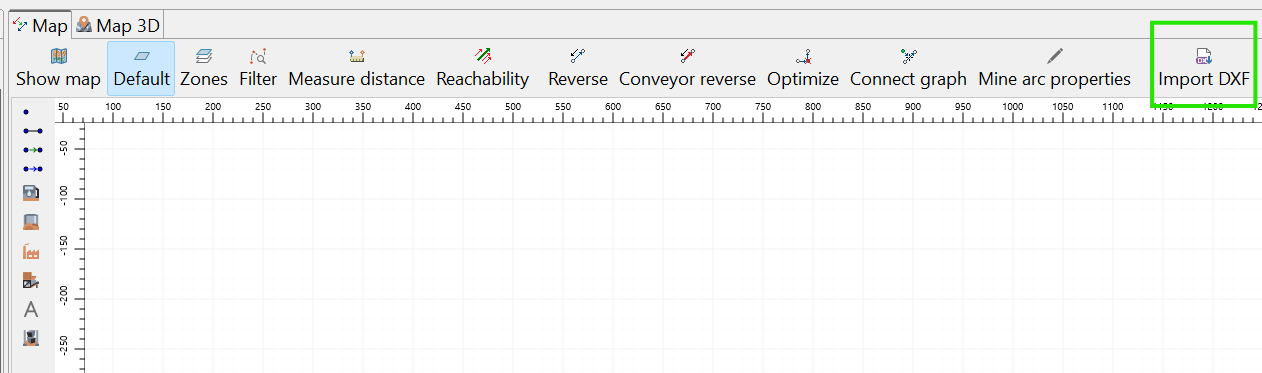
The following dialog window will open:

Click the Import DXF button as per the screenshot above. In the new dialog that opens, select the DXF file you downloaded and saved on the previous step of this tutorial and click Open. MineTwin will open and parse the DXF file and show a preview of its contents by layers.
In our sample DXF file, there are 2 layers; one of them is empty, and the second one contains the data about the mine transportation network:

Now, we can click OK to import the data to our scenario.
3. Review the mine layout in 2D and 3D
As a result of importing, MineTwin creates the transportation network in the form of nodes and arcs. The number of created nodes and arcs is shown in the scenario tree:

These nodes and arcs constitute the transportation network of a sample underground mine. You can view the mine layout in the Map window, zoom and scroll using both your mouse and the buttons in the upper part of the window. To zoom in and out, use the mouse wheel, and to move the canvas, right-click and drag
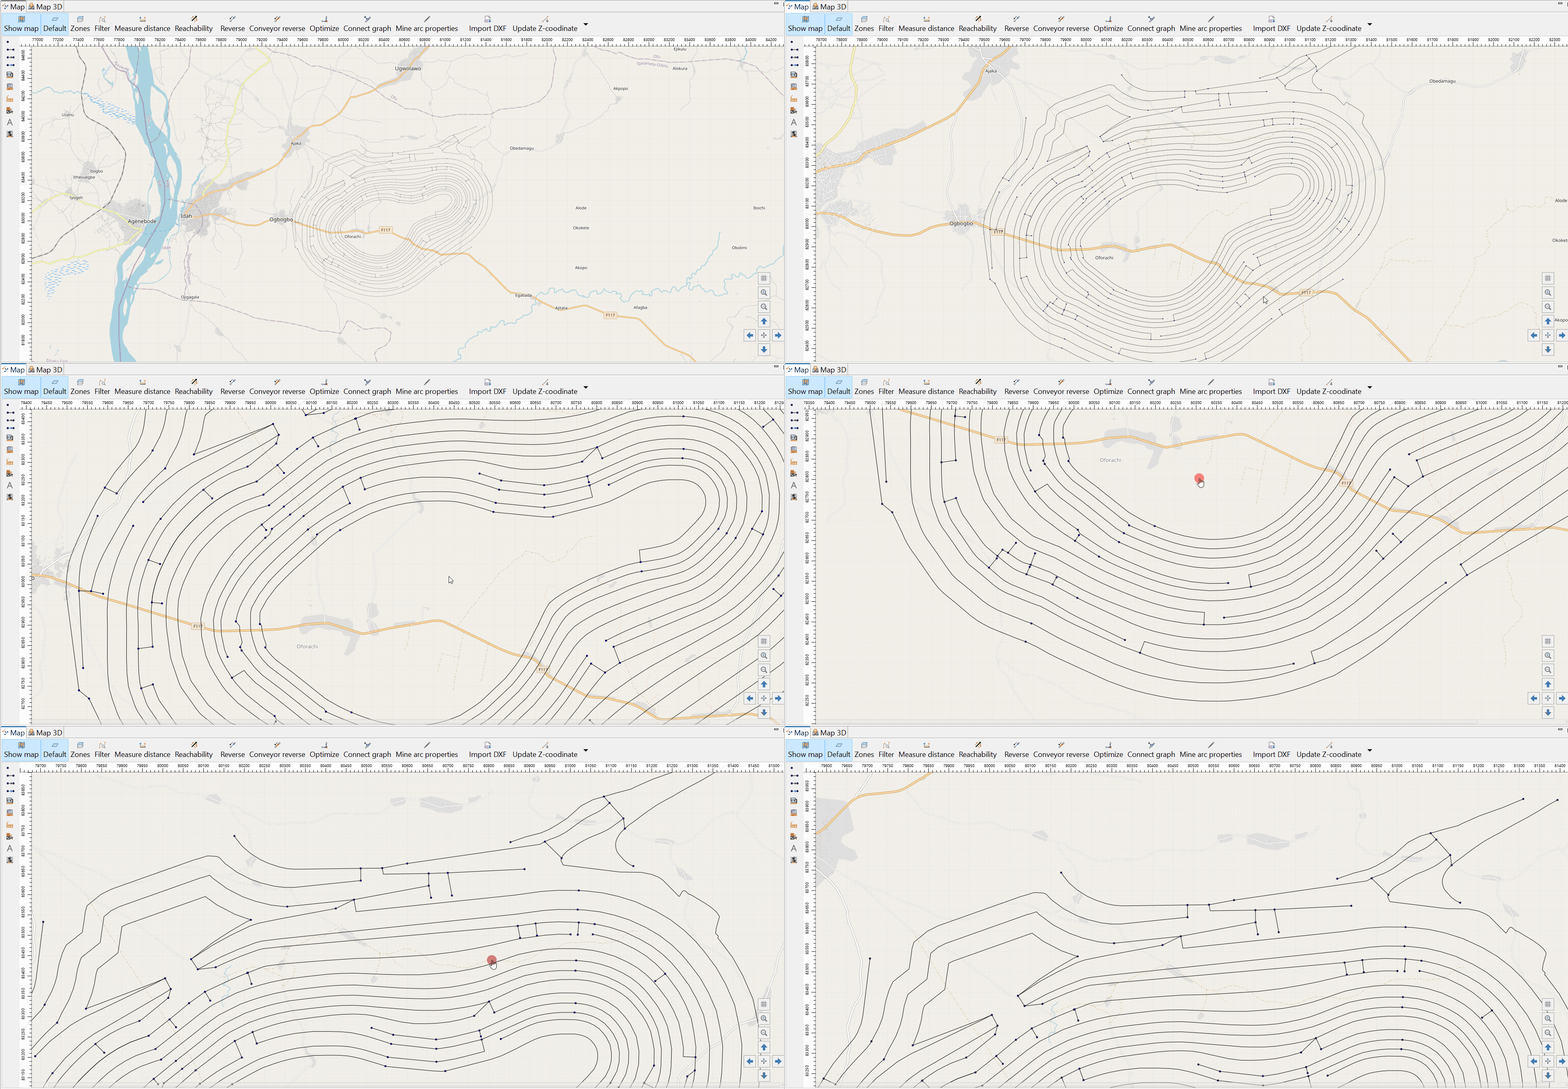
Note that the imported mine layout is three-dimensional, i.e. all nodes and arcs have a Z-coordinate. Use the Map 3D window to view the layout in 3 dimensions. Use your mouse to adjust the 3D-view of the layout:

4. Check the connectedness of the network
For the simulation logic to execute correctly, it is important to make sure our network is connected. A network is considered connected if there is a path between every pair of nodes, meaning that you can traverse from any node to any other node in the network by following the arcs between them. In other words, all places of our network must be reachable from any given node.
MineTwin provides functionality to check the connectedness of the transportation network. To highlight all fragments of the network, click the Reachability button in the Map window, All isolated fragments of the network will be highlighted with different colors, as shown below:

As you can see, there are a lot of isolated fragments in our current network despite the fact that it looks connected. Press the Escape button to deactivate the highlighting.
There is another way of looking at the connectedness - checking what parts of the network are reachable from the specific arc. This can be done by selecting some arcs in the Map window and clicking the same Reachability button as shown in the picture below:

In this case, the reachable part of the network is highlighted with green, and everything else becomes red. Again, you can press the Escape button to deactivate the highlighting.
5. Fix the connectedness of the network
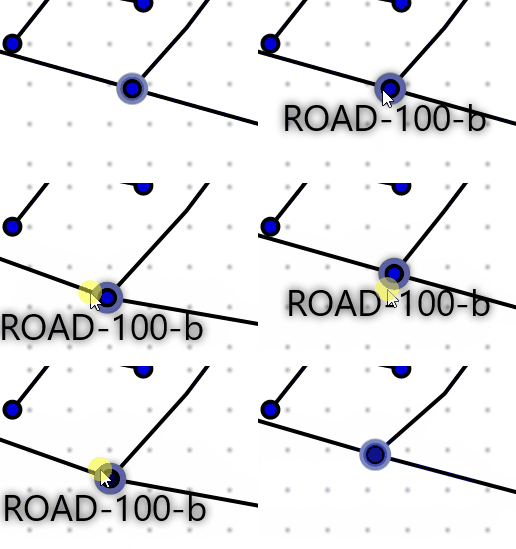
At first glance it appears as if this network is completely connected. However, in the previous section, we saw that our network is not completely connected. This is the case because there are nodes at the places of visual intersections, but logically, these nodes are not really intersection nodes. This can be easily checked by attempting to drag one of such nodes:
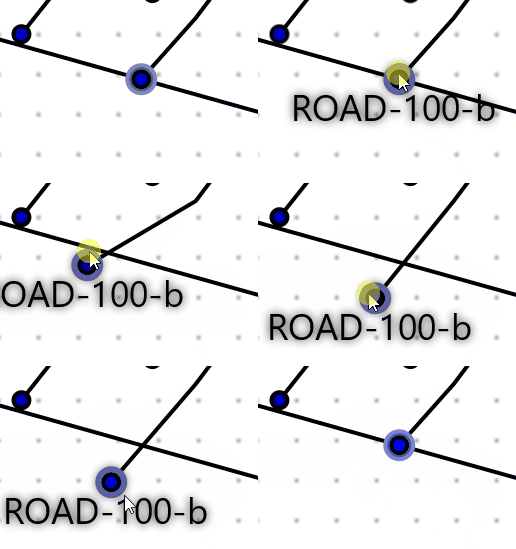
After dragging, hit Ctrl+Z to undo the changes.
So, we want such nodes to become real intersection nodes. This can be done by selecting all of the nodes and arcs and clicking the Connect graph button at the top of the Map window:
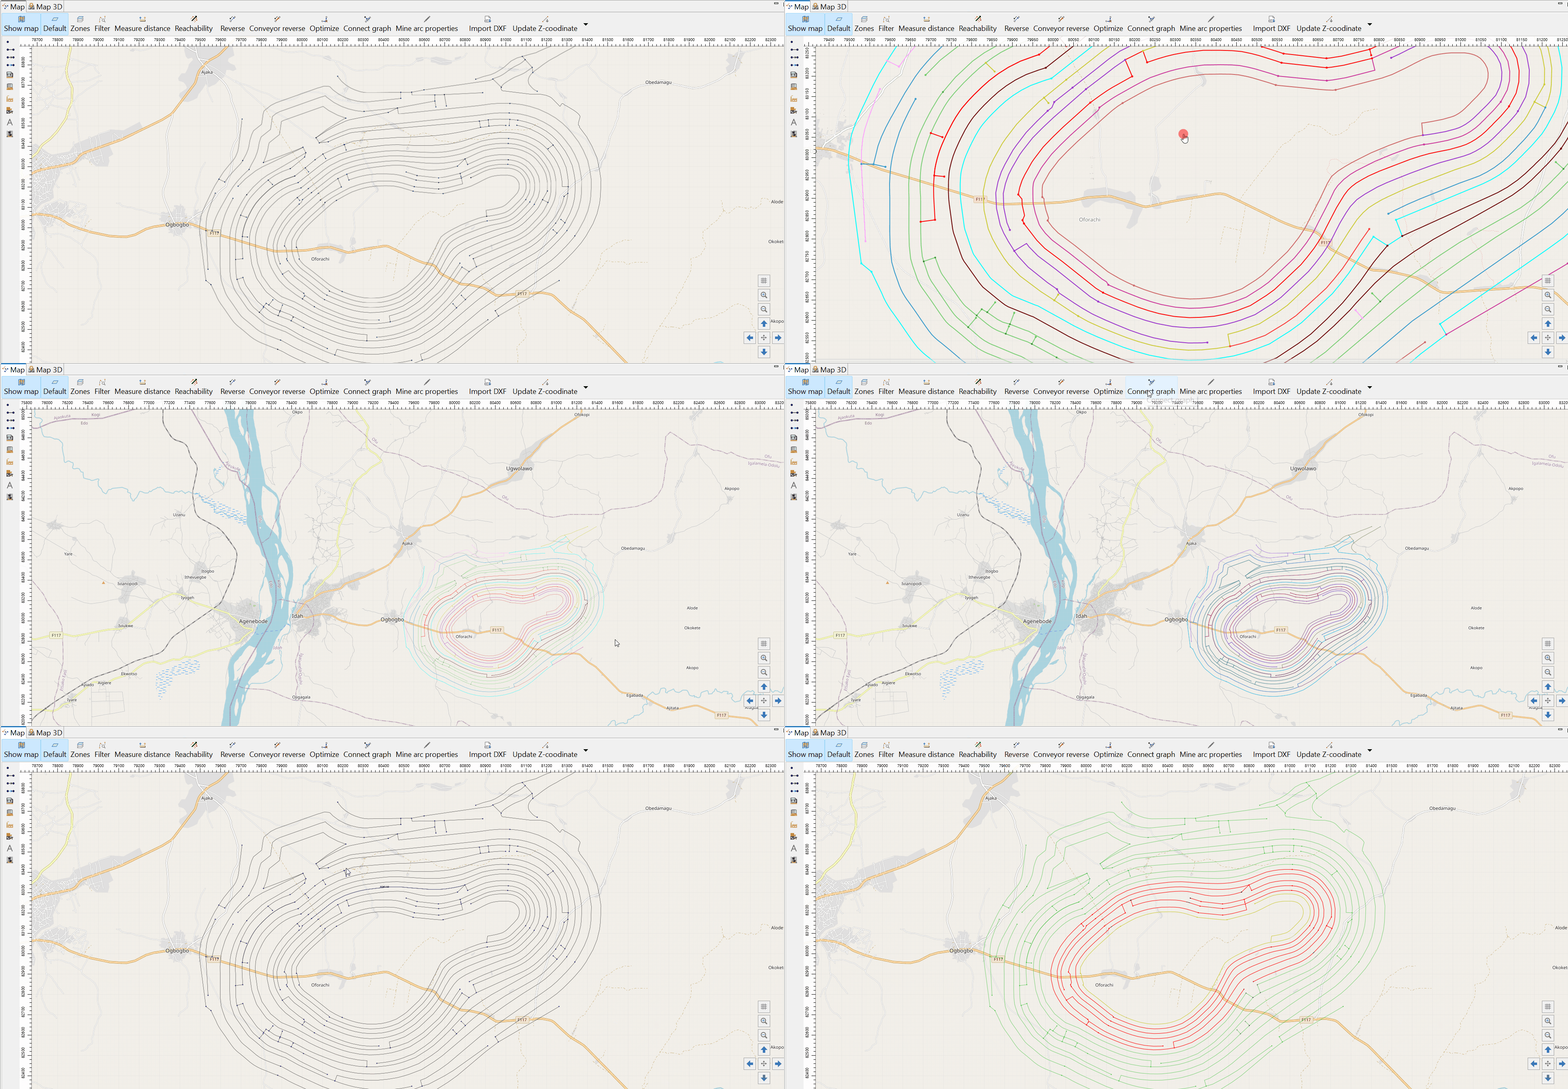
This intersection also considers the Z-coordinates of nodes and arcs: It will not create an intersection node if the node, and the arcs are too far apart from each other on the Z-axis.
Now, let us navigate to the same node and try dragging it to make sure it has become a true intersection node:
We can also now check what part of the network is reachable from our arc. To do this, select the arc and click the Reachability button above the map:
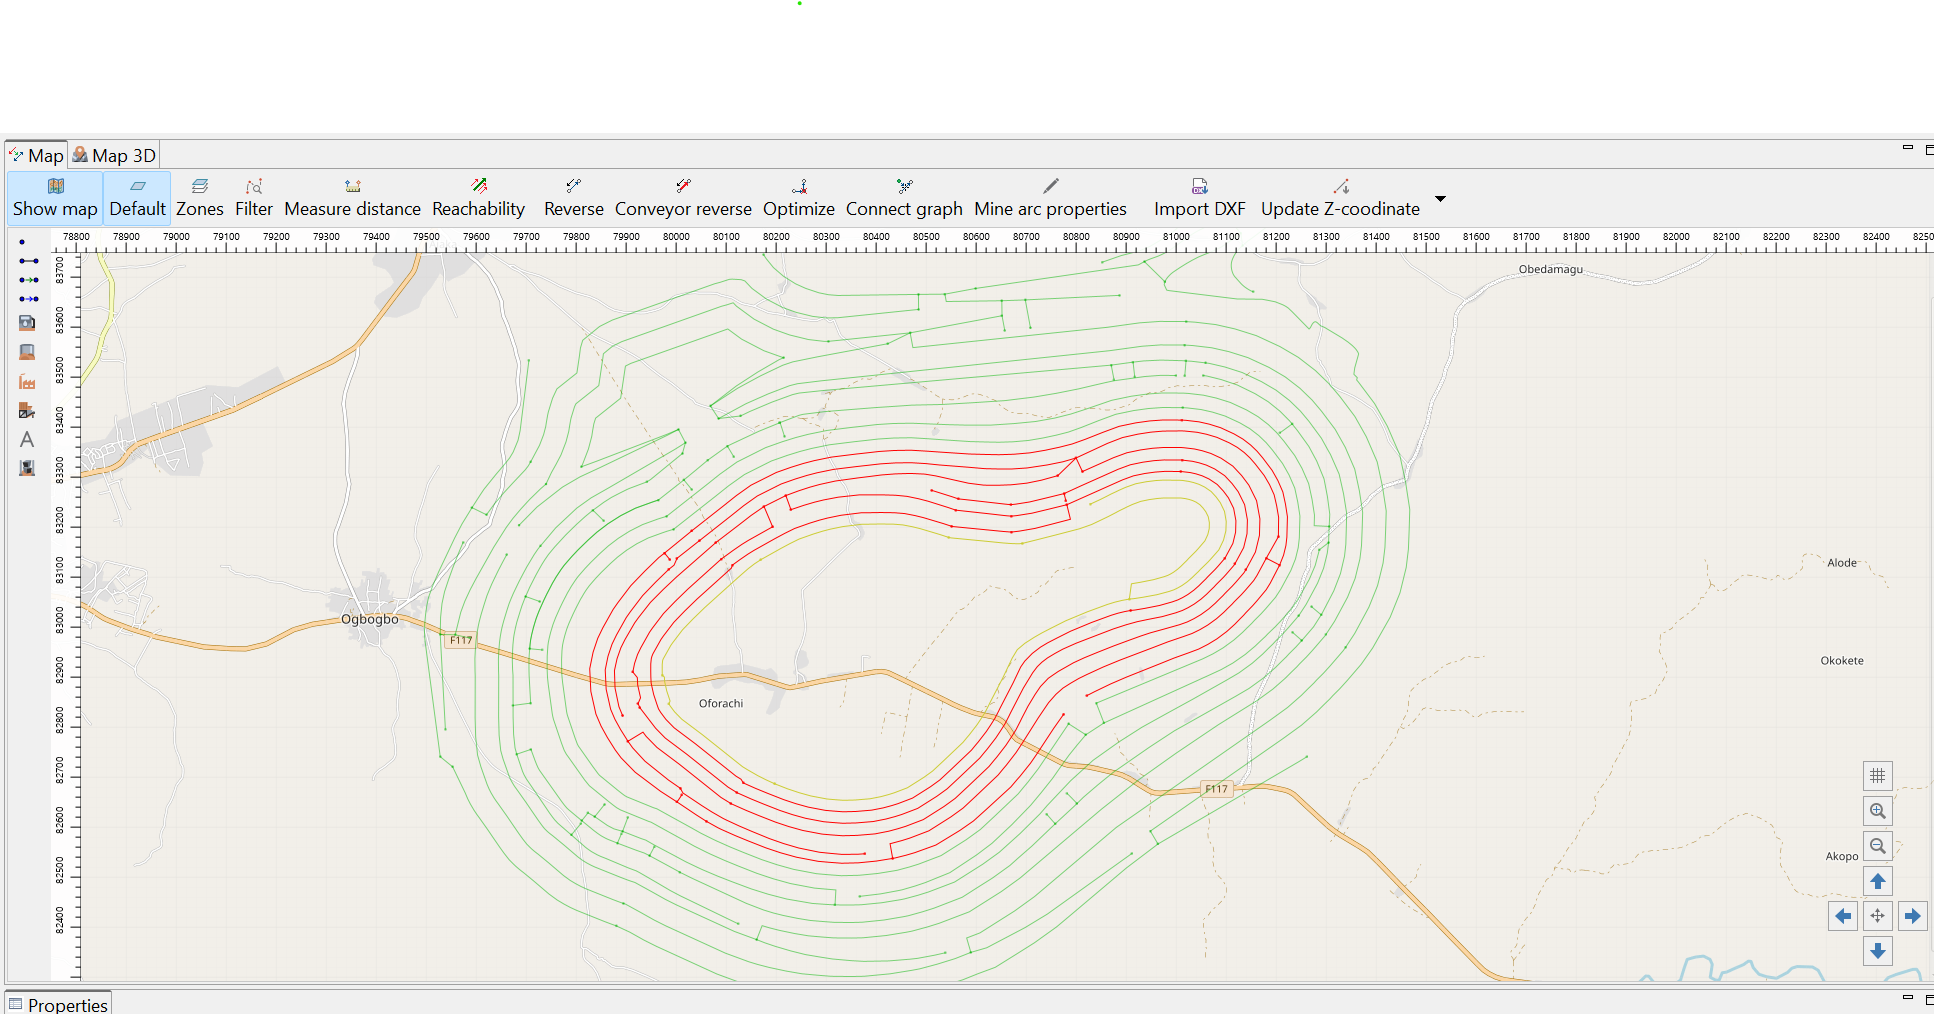
You can see that most of the network is green now, meaning it is reachable from the selected arc. Press the Escape button to deactivate the highlighting.
The last steps to fixing the reachability issues on this specific mine layout can be achieved through manually drawing in additional roads.
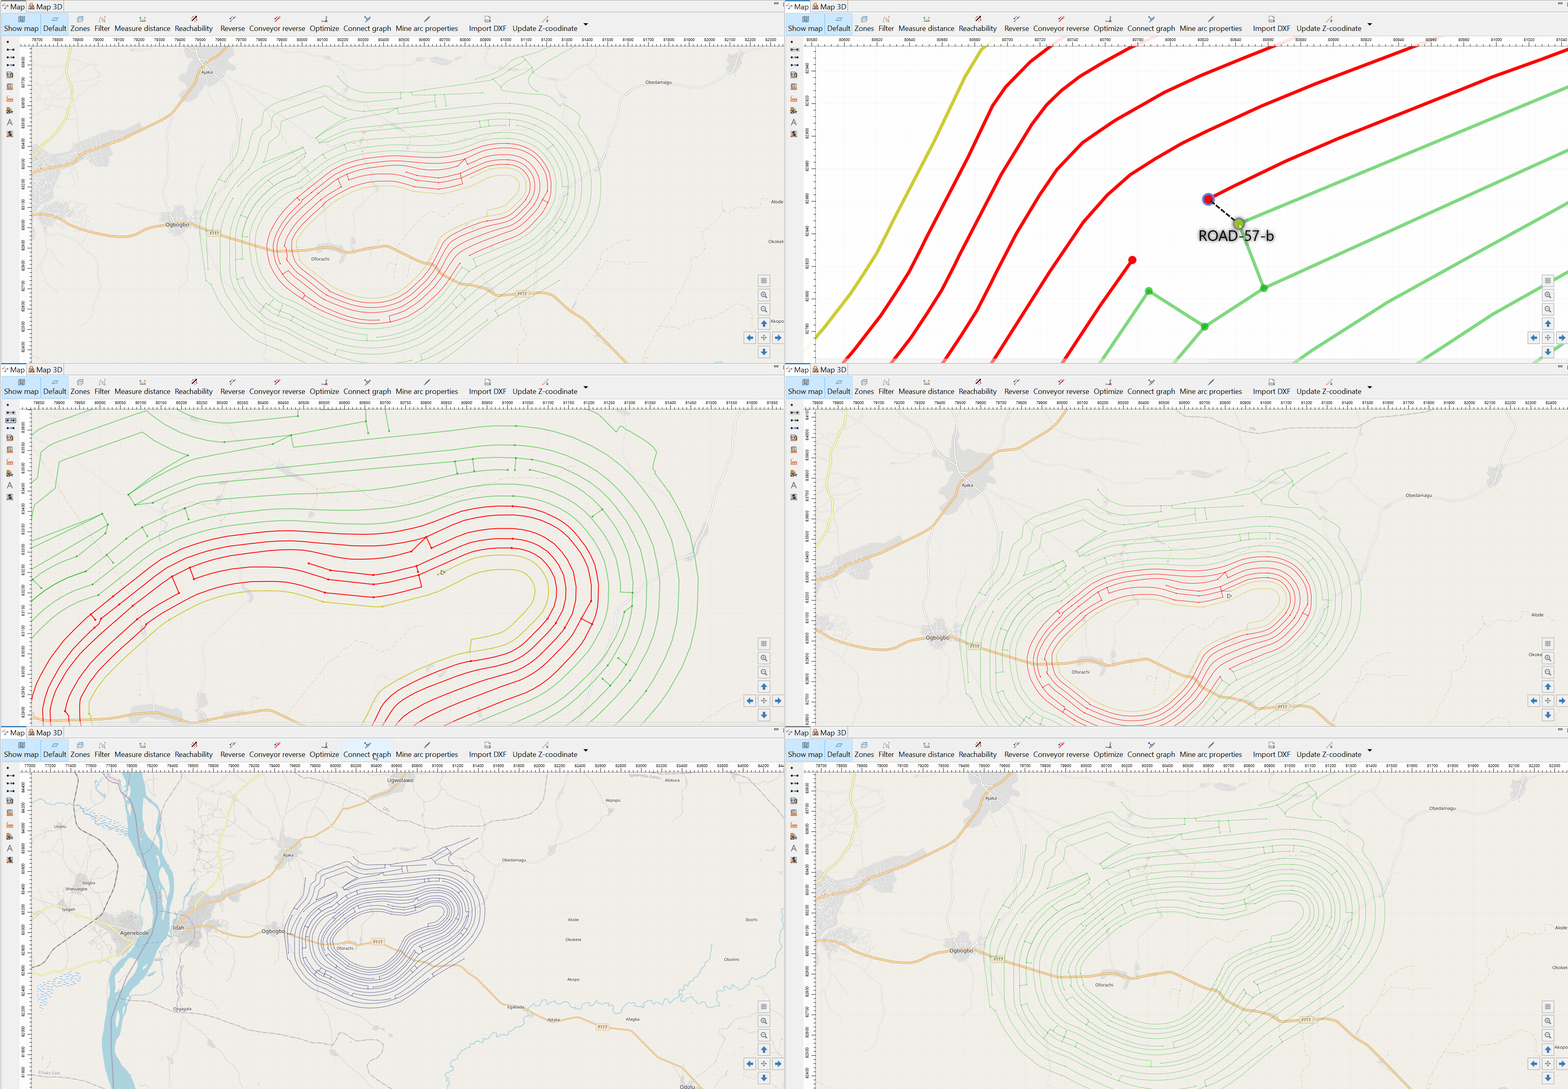
If we do a final check now, all roads will be a single color, green, indicating all roads are connected.

So, we have imported, reviewed and fixed the mine layout. Now it is time to save it by clicking the Save menu button or by simply clicking Ctrl+S.
You can always download the result of this tutorial step here.