Add stopes and increase target
In this section, we will proceed with the scenario developed in the previous step. Ensure that this scenario is currently active in MineTwin before moving forward.
We will now focus on adding more stopes, i.e. places from which we extract the ore.
1. Make sure everything is ok with a single stope
Let us simulate our scenario till the end and check the end state of our simulation model. Below is how the MineTwin window will look after finishing the simulation experiment. :
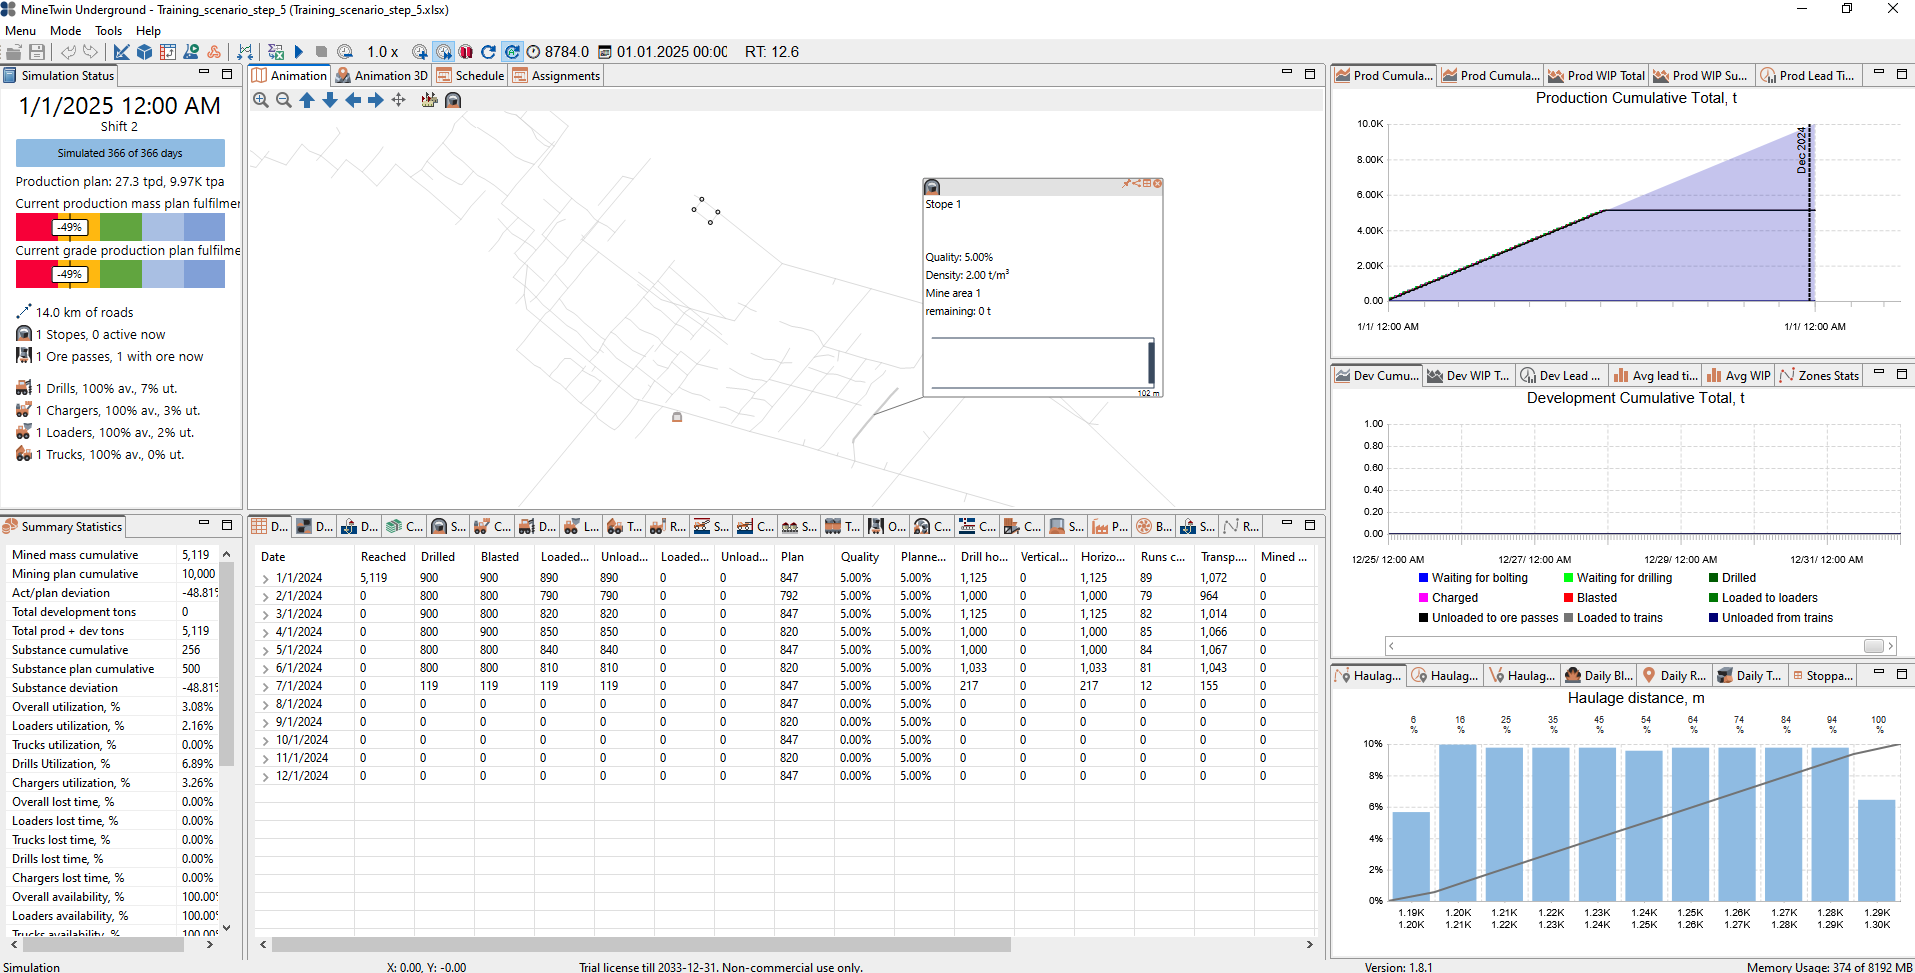
You might need to zoom out of the Production Cumulative Total, t chart in the top right corner to replicate the screenshot above. You can do this by clicking on the chart and scrolling with your mouse.
On the Simulation status view, we can see that 365 days of the mining operations have been simulated:
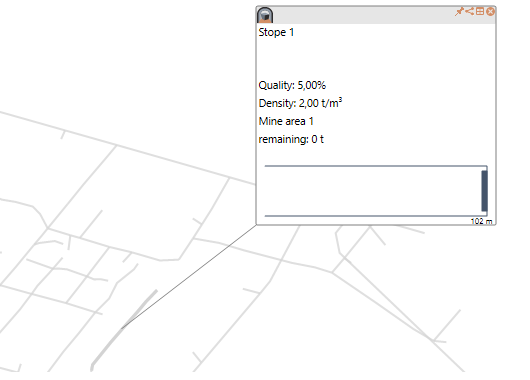
On the Animation view, we can also see that our stope has been emptied:
Indeed, on the Production cumulative total view, we see that we were meeting our target up until July. When the production line went flat:
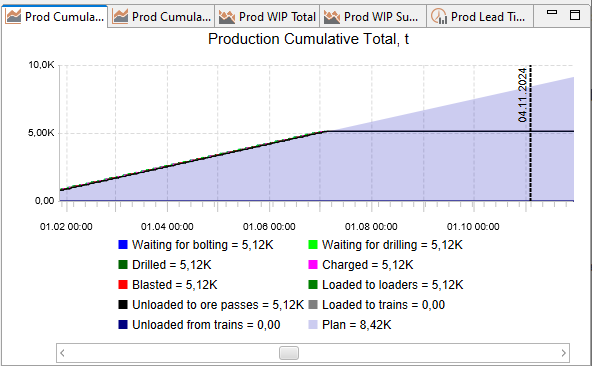
Note: You can click on any chart to show a vertical line with the date, and then all the legend items will show the exact value at the specific point in time
So, we have made sure our only stope is mined till its end in our scenario.
2. Specify other stope locations
Let us now go back to Editor mode and create several stopes using the Stope palette tool. Feel free to create as many as you want:
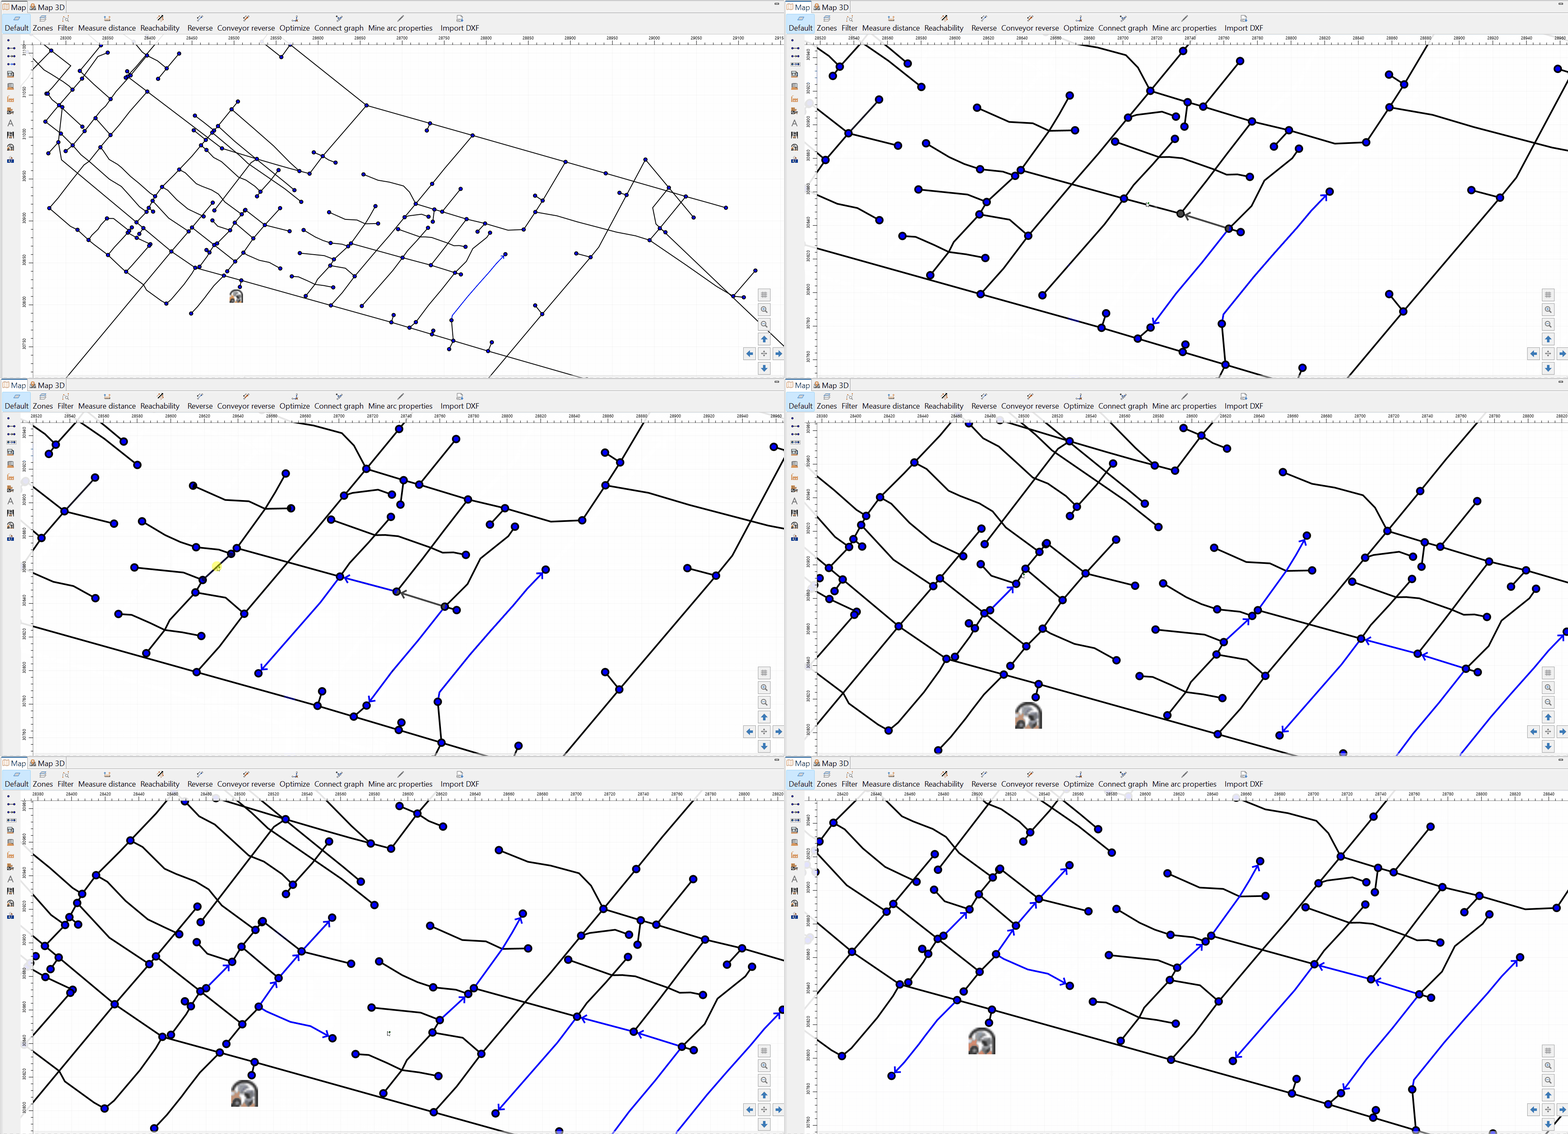
Make sure the direction of the stopes makes sense. Below is an example of a stope direction that will not work as the direction of development goes into the road, and there is no way to access the stope from the starting point of the stope.
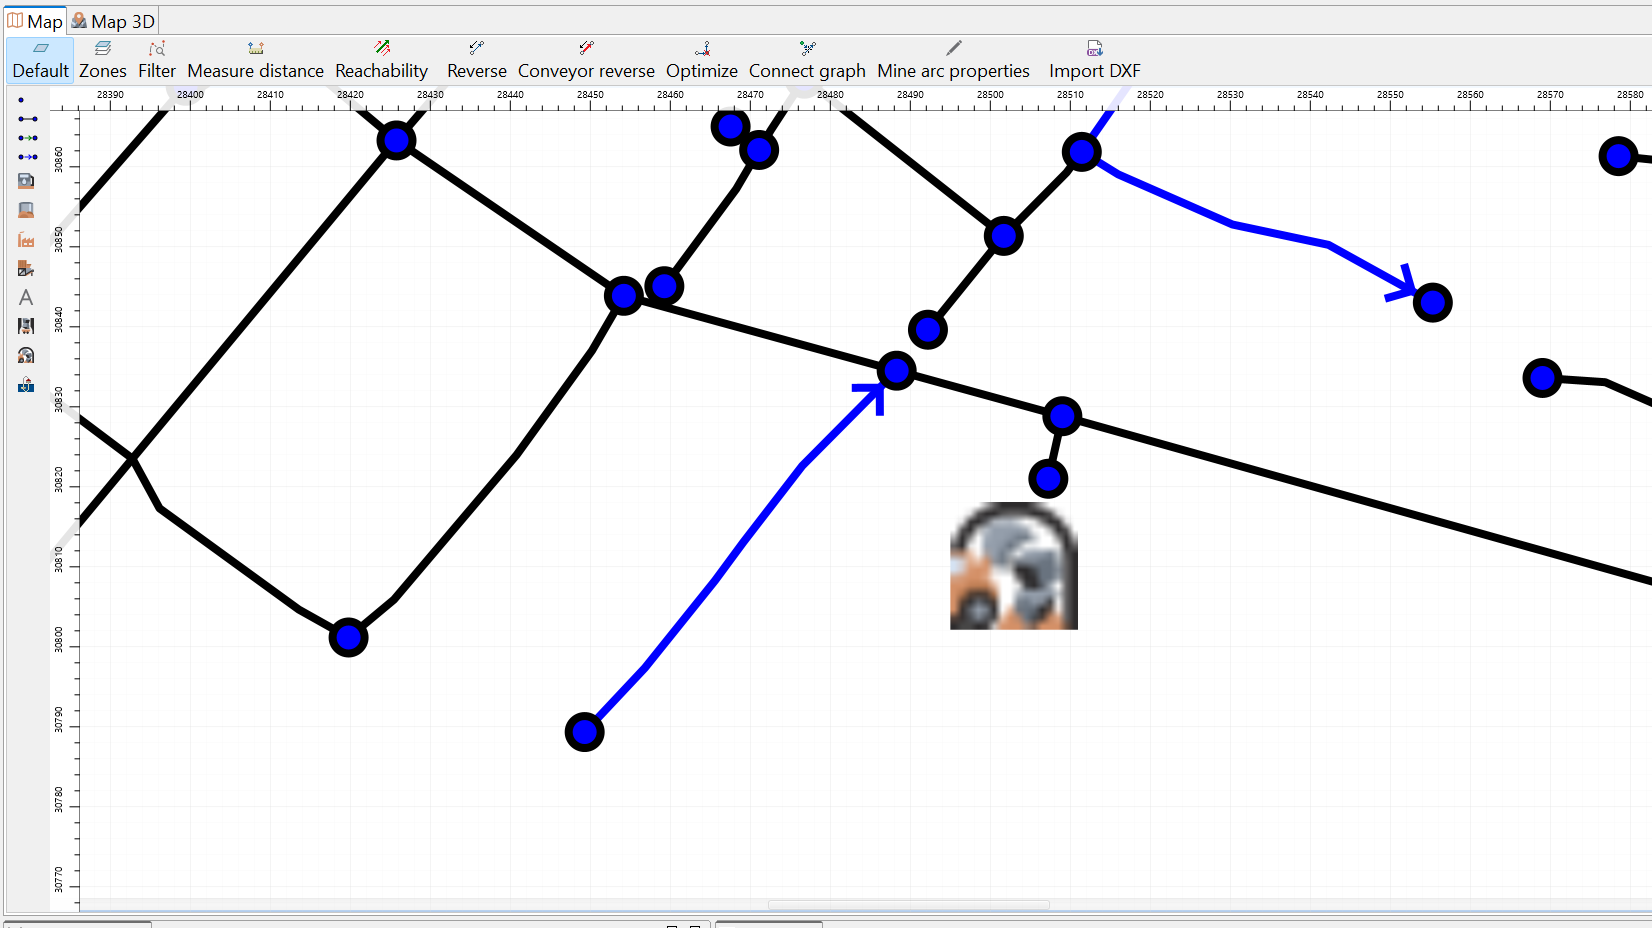
In case it does not, use the Reverse button in the upper part of the Map view.

Now let us review the stopes we have just created in the Stopes table view:
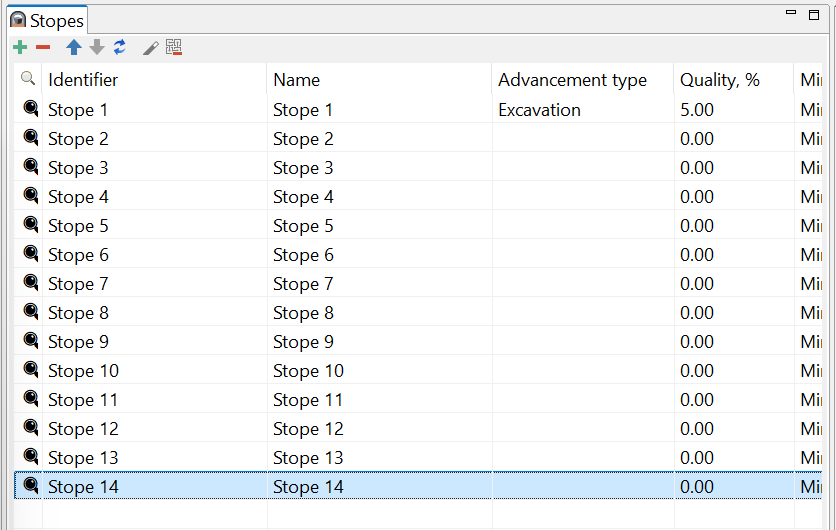
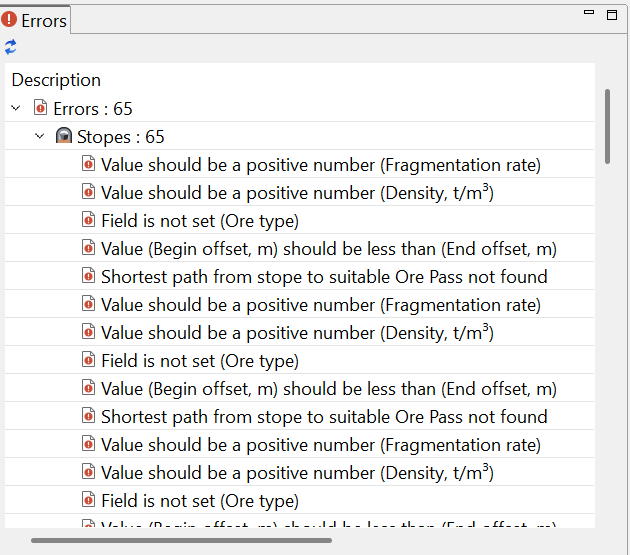
Now we have created our stopes and corresponding mine segments, but we have not defined any properties for these stopes (i.e. material mix, mining method, etc.). We can now click the Check button and see how MineTwin points us to these multiple missing properties:
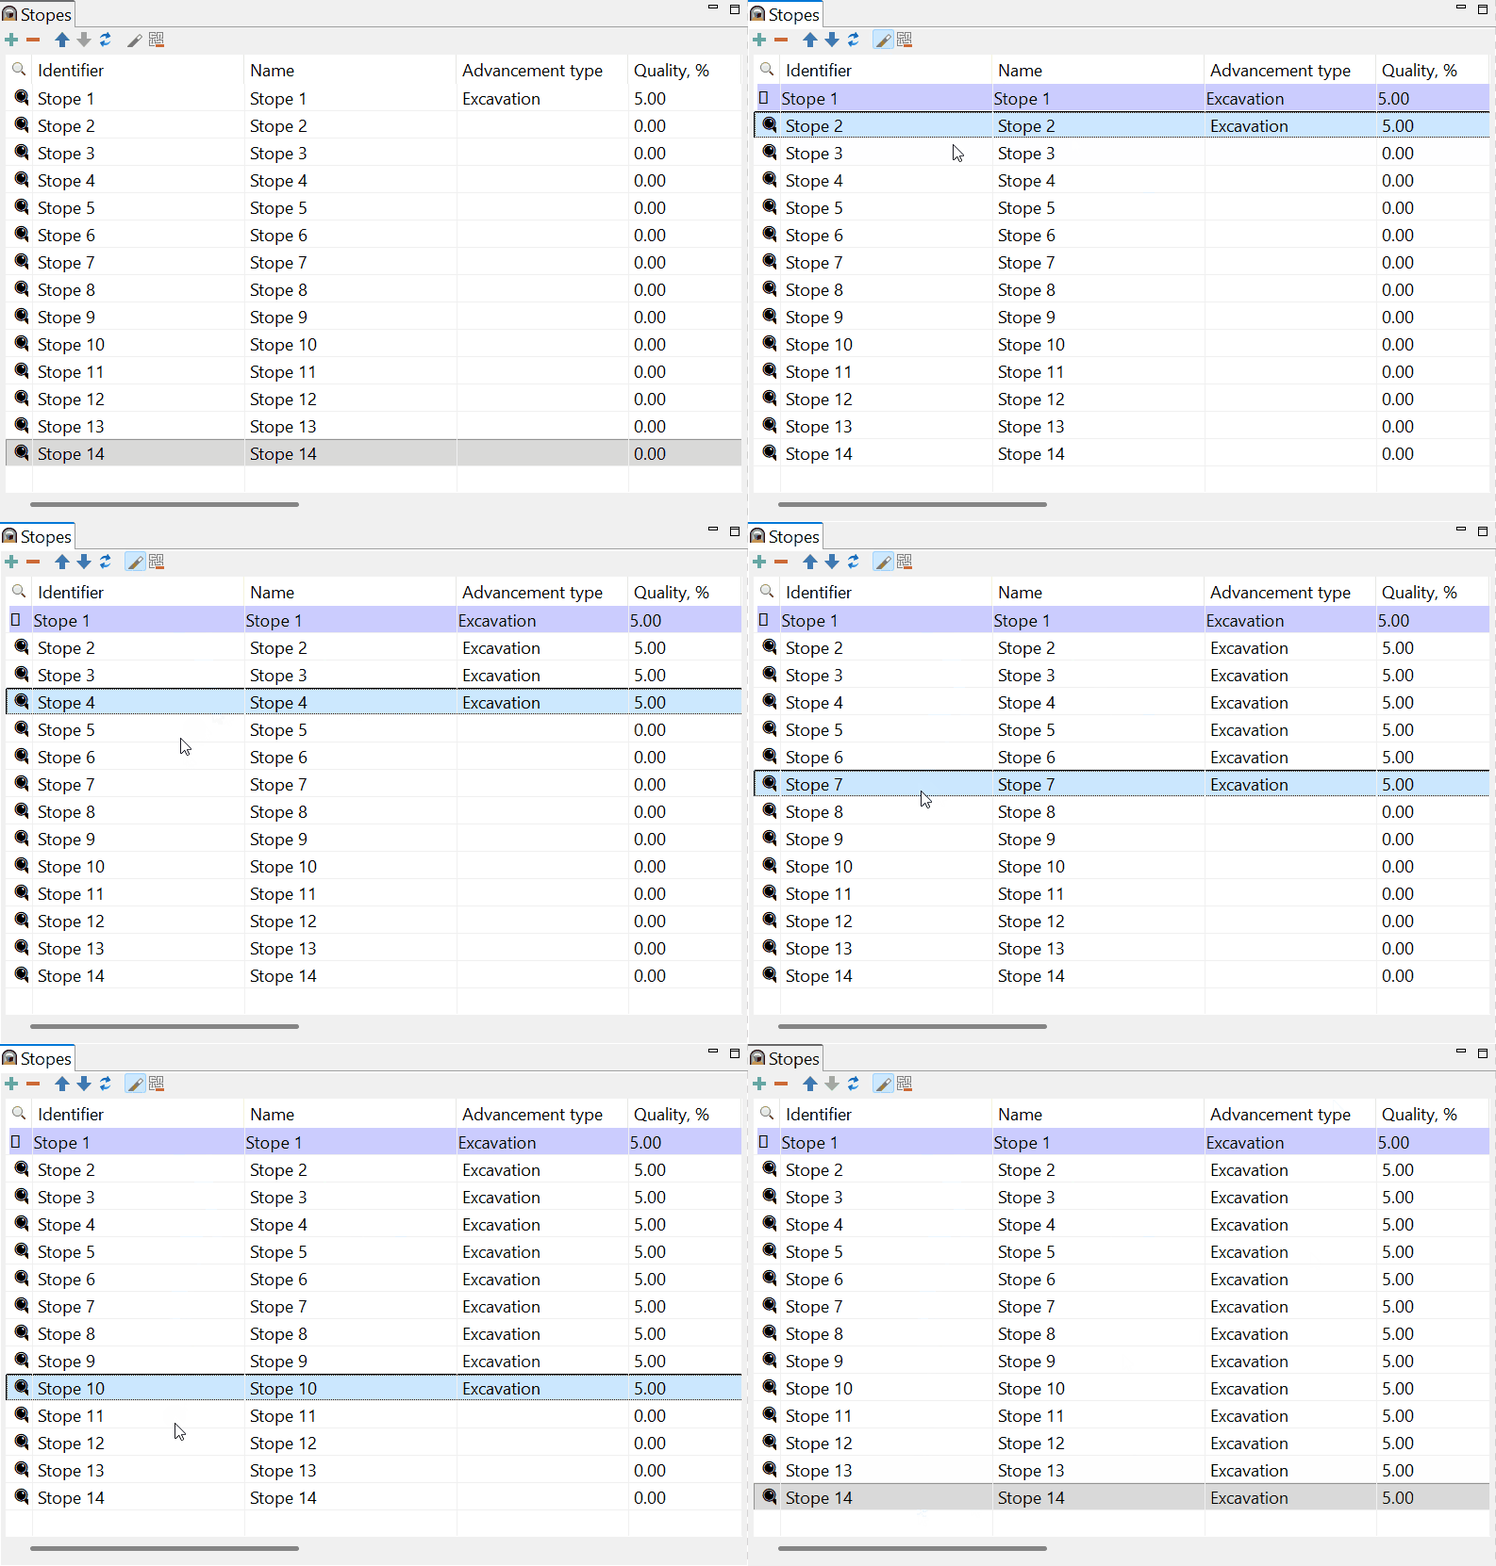
MineTwin provides a stope properties copying tool similar to the "Format painter" tool of Microsoft Office applications.
To do this, you can right-click on the block with the properties you want to copy and select Create stope pattern from the context menu. You can then select the new block where you want to paste the first block’s characteristics by right-clicking and selecting Apply stope pattern from the context menus.
On Windows, the block copying tool can be activated by clicking the stope pattern button in the upper part of the stopes table view. Let us now activate this tool and apply the properties of our first block to all other blocks by Ctrl-clicking the lines in the stopes table.
We can now click the Check button once again to make sure all the errors are gone.
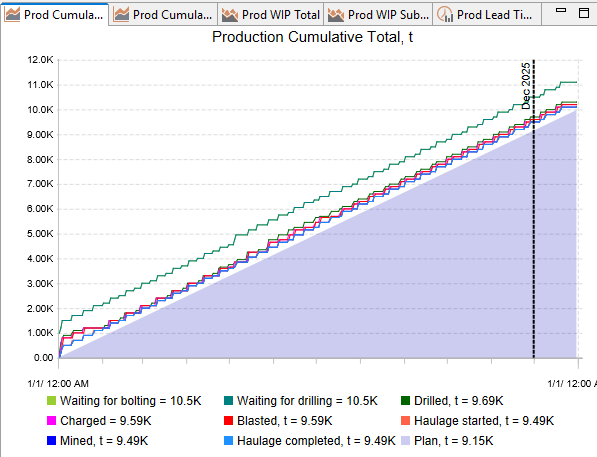
If we now go to the simulation mode and run our scenario again, we will see that we are perfectly meeting our target:
3. Adjust simulation period and production target
Let us now go back to the Editor mode and do the 2 final adjustments before going into the scenario analysis mode.
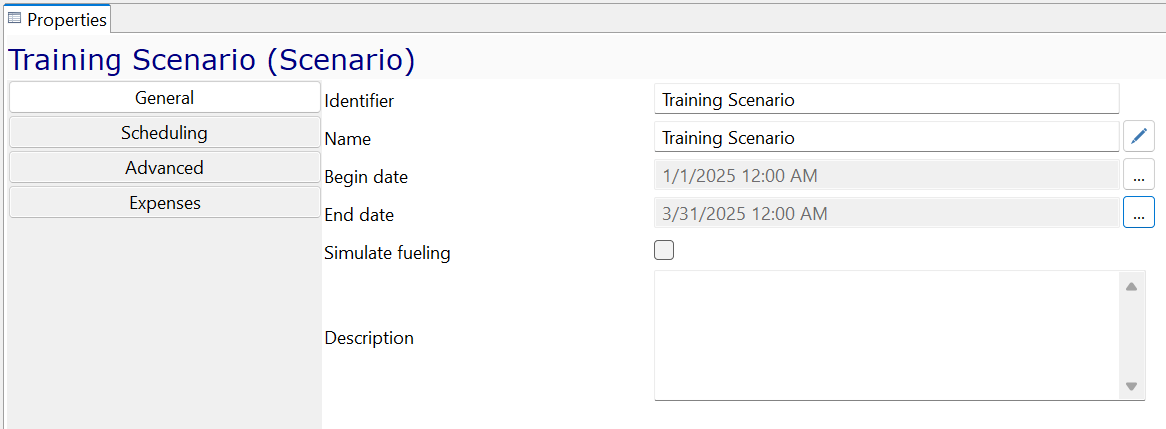
Firstly, let us shorten the simulated period to just 3 months:
Secondly, let us adjust the end date of our target accordingly and increase the production target to 50Kt per 3 months (200Kt per annum):

Note: The format of the date is dependent on your local machine settings and might look different compared to the screenshot above.
Let us now save the scenario and rerun the simulation. Note how we are now falling 64% behind our target in our 90-days scenario:
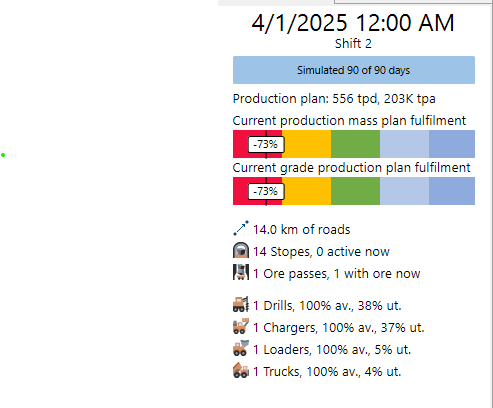
Here is the scenario that must be the result of this training.