MineTwin Study Mode
Introduction
The Study mode is designed for conducting structured simulation experiments based on MineTwin scenarios. It allows users to analyze constraints, select an appropriate fleet configuration, and assess how sensitive results are to changes in model parameters.
This mode helps answer questions such as:
-
which constraint has the strongest impact on achieving the plan;
-
which fleet composition change would bring the result closer to the target plan;
-
how results would change if the amount of equipment changes;
-
which factors have the greatest influence on the final KPIs.
A study is created based on an open scenario. After creation, you can add steps, run automated study modes, execute calculations locally or on the server, compare results, and generate reports.
This structured approach improves analytical efficiency by making it easier to formulate and test hypotheses and quickly obtain well-grounded, reliable answers.
Creating a New Study
-
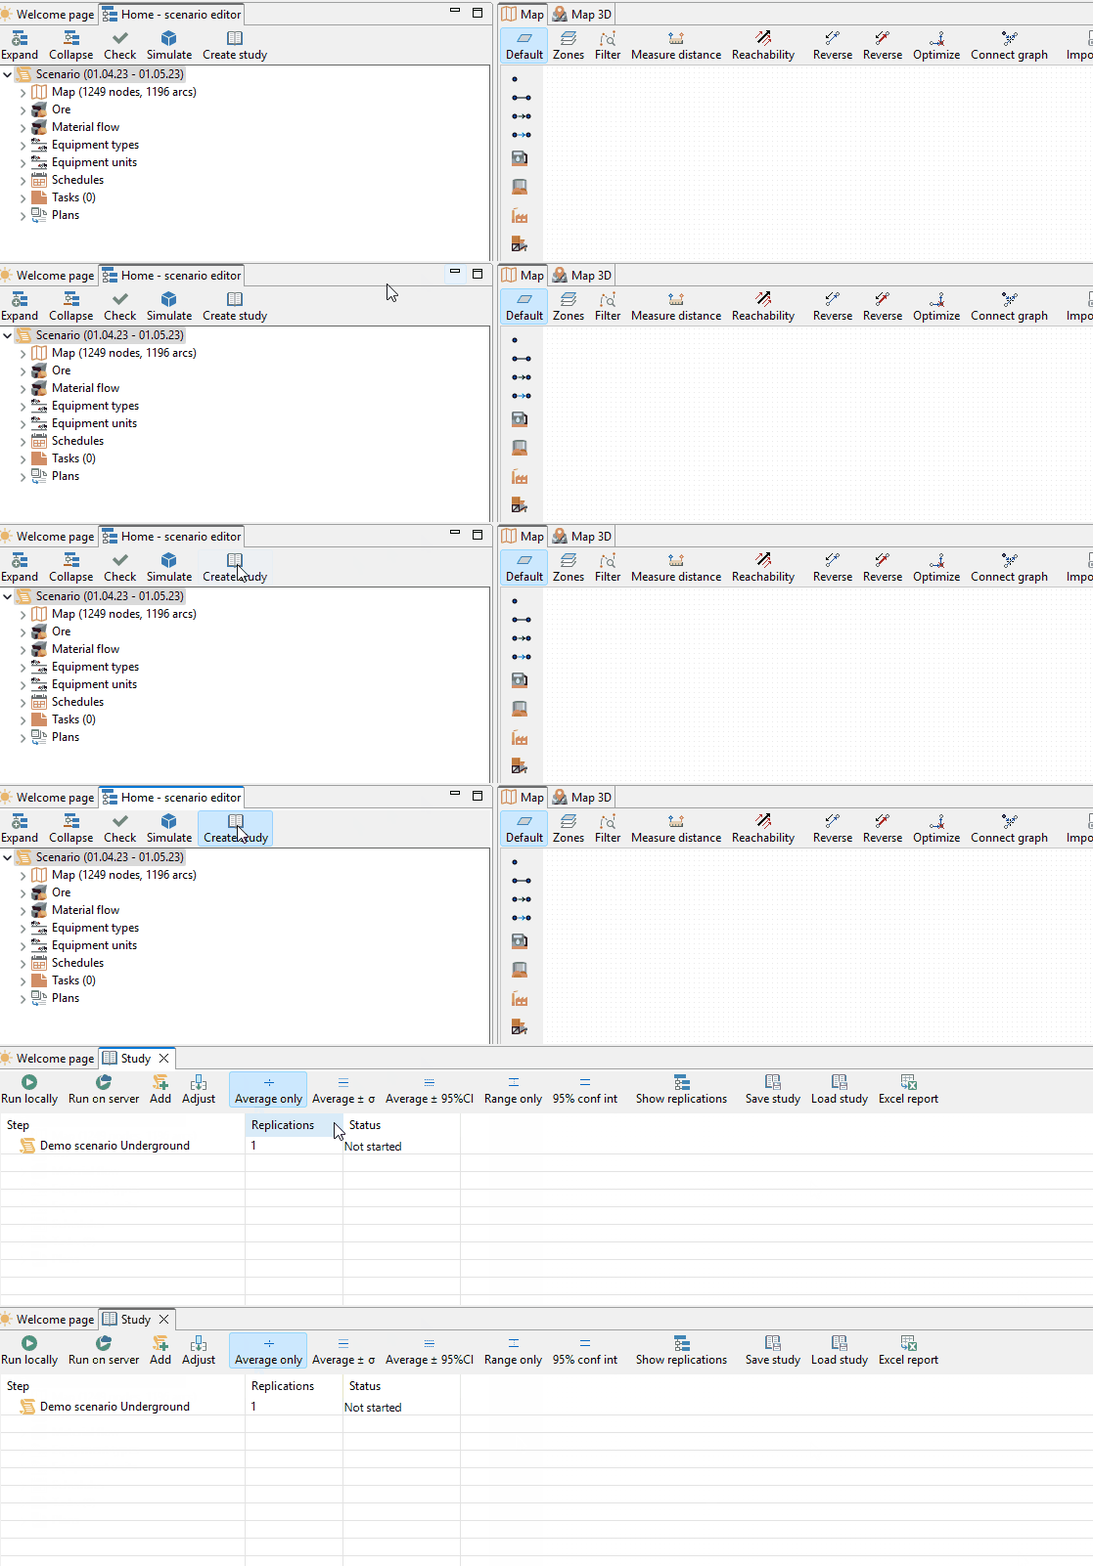
Open the required scenario.
-
Click Create Study on the toolbar.
-
The study opens in a new tab.
-
The current scenario becomes the study’s root step. Child steps can be added to it.
The following commands are available for managing a study:
-
Rename — a dedicated button on the study toolbar;
-
Save and Save As — save the study as a ZIP archive;
-
Open Experiment — open a previously saved study from the top menu in the Menu group.
Steps and Modifications
A study is built as a tree of steps. The base step contains the original scenario with no changes. Subsequent steps can:
-
inherit the scenario from the previous step and contain one or more modifications;
-
be executed with multiple replications;
-
be used as a basis for further experiments.
The user can:
-
apply a modification to any study step;
-
run an automated study for any step;
-
create a new study from an intermediate step via right-click and the context menu;
-
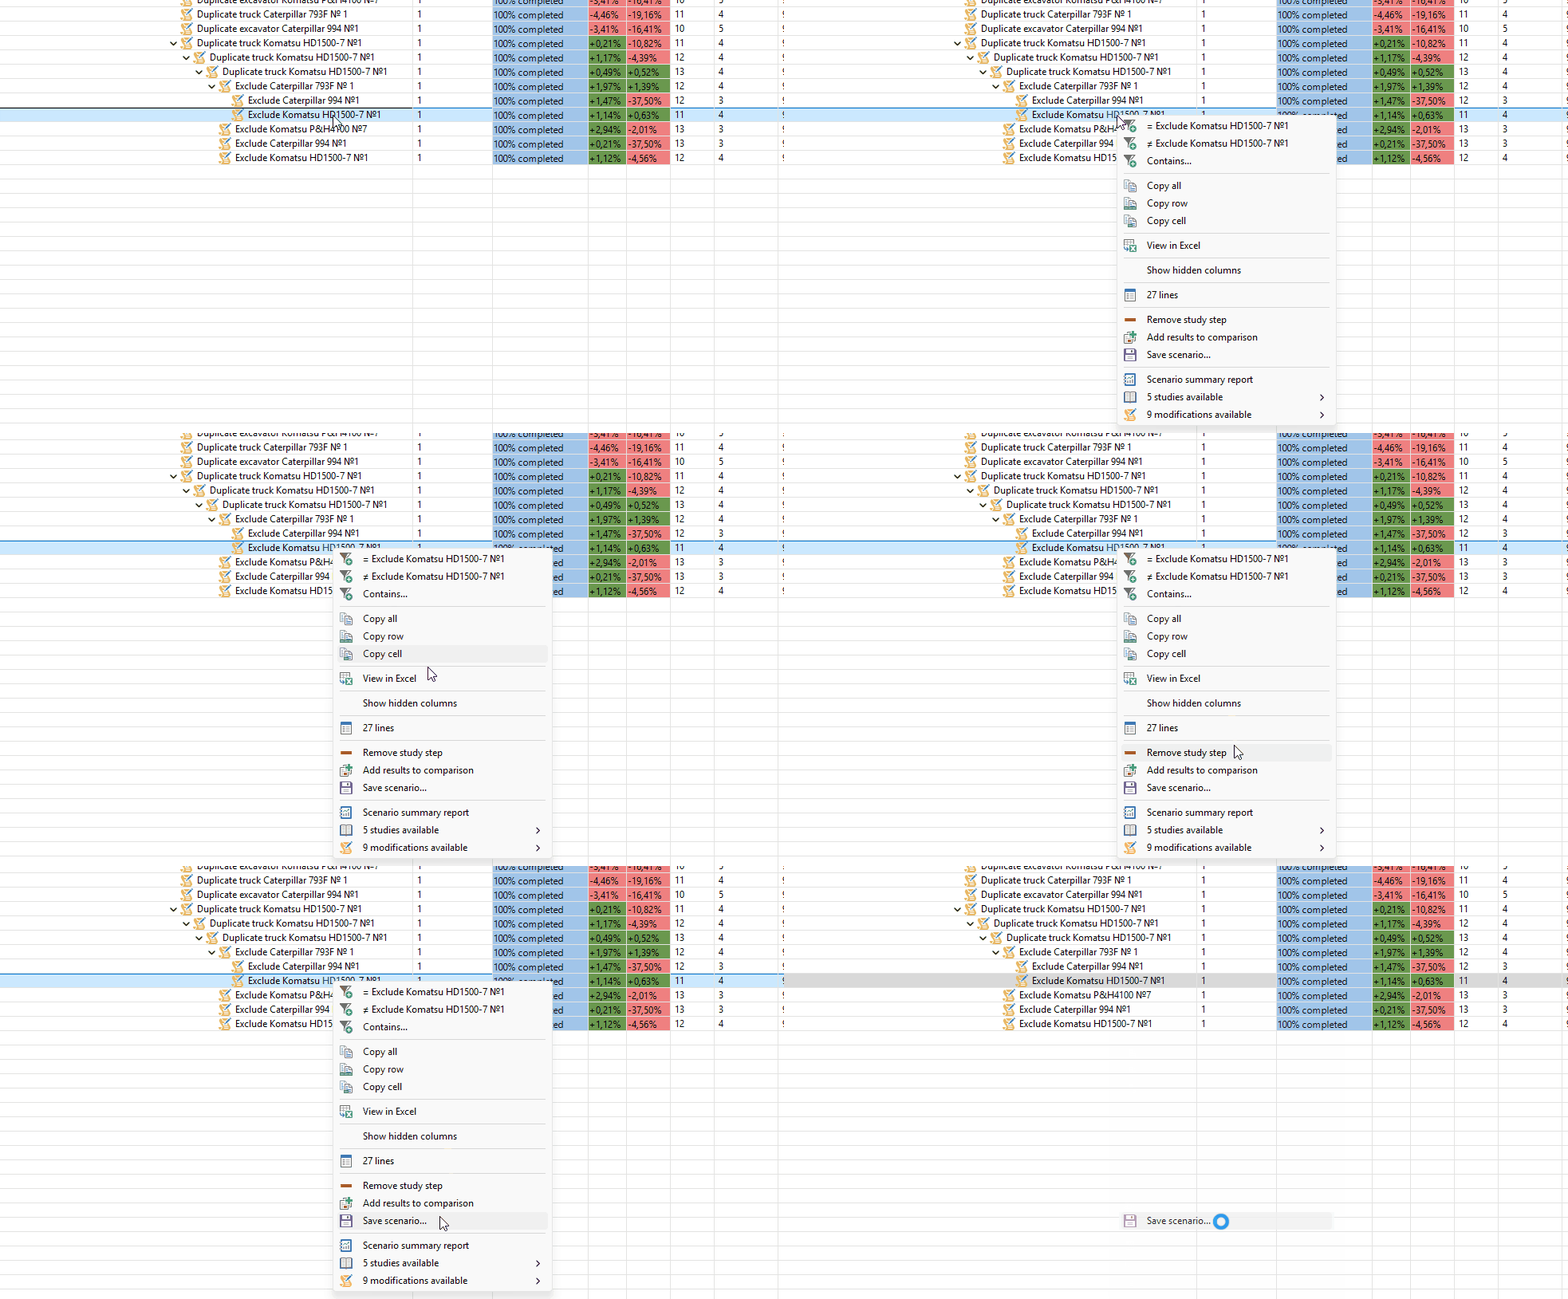
save any step as a separate scenario via right-click and the scenario save command;
Adding Modifications Manually
-
Select an existing step.
-
Right-click the step and select "XX modifications available" from the context menu. The total number of available modifications depends on the MineTwin version.
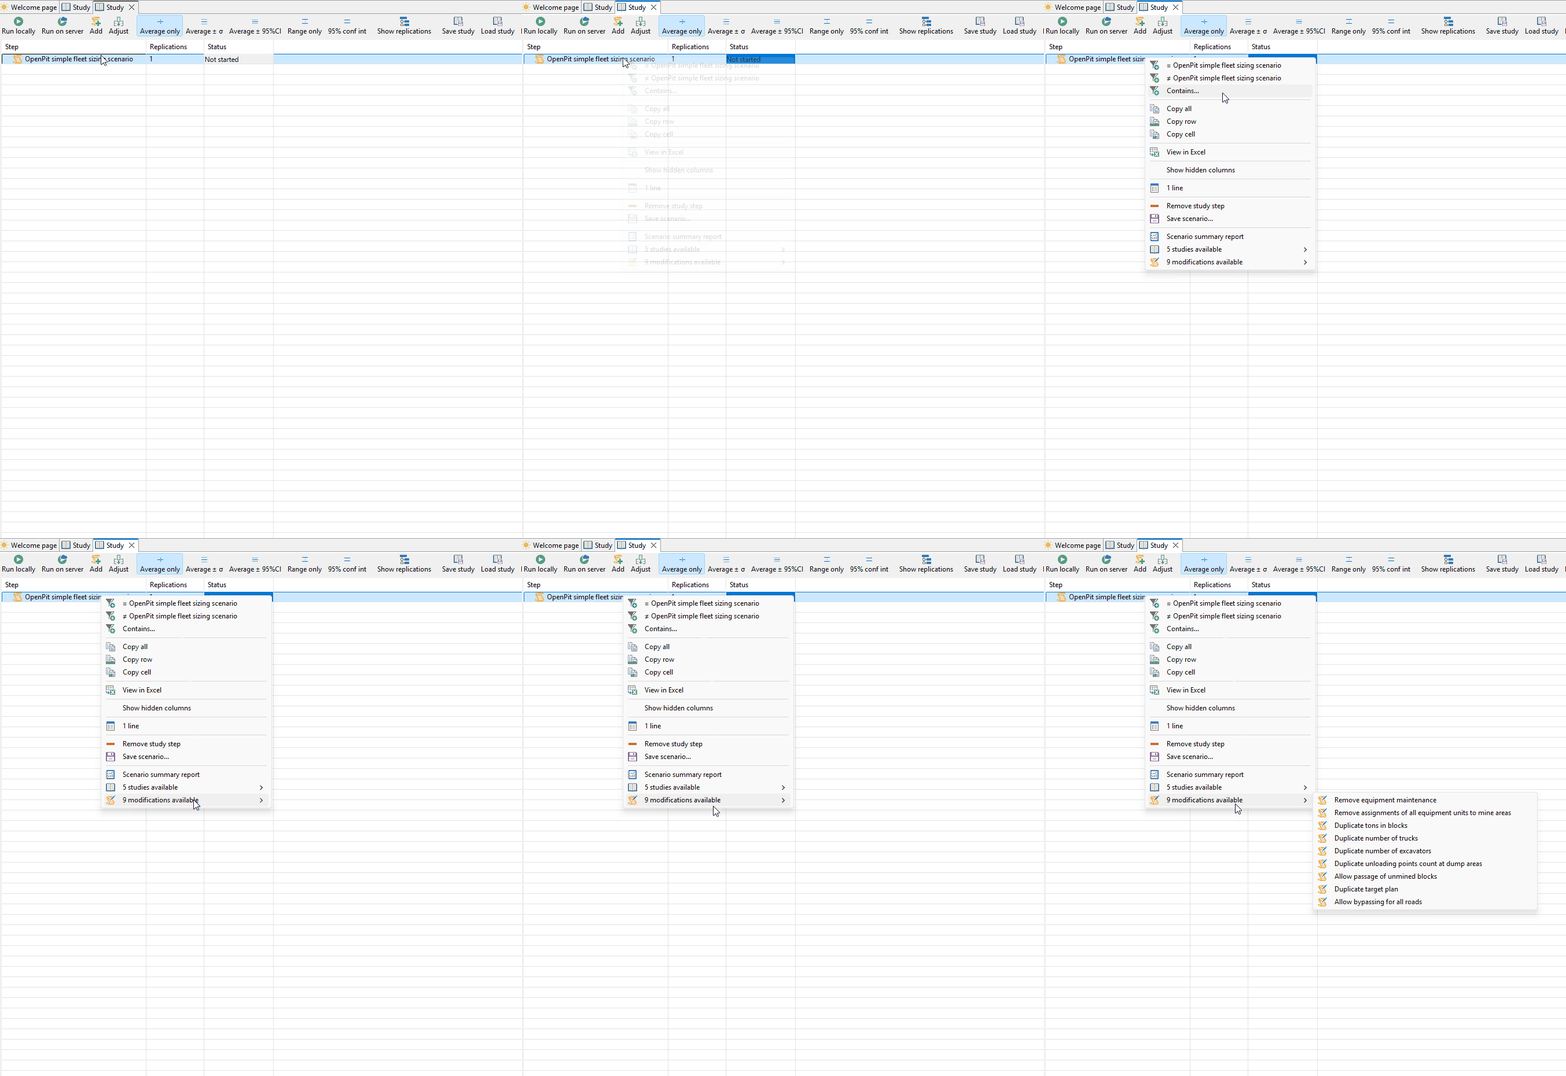
Modifications include:
-
Removing maintenance downtime
-
Removing equipment assignment to mining areas
-
Doubling the number of trucks and excavators
-
Allowing passage of unmined blocks
-
Duplicating the target plan etc.
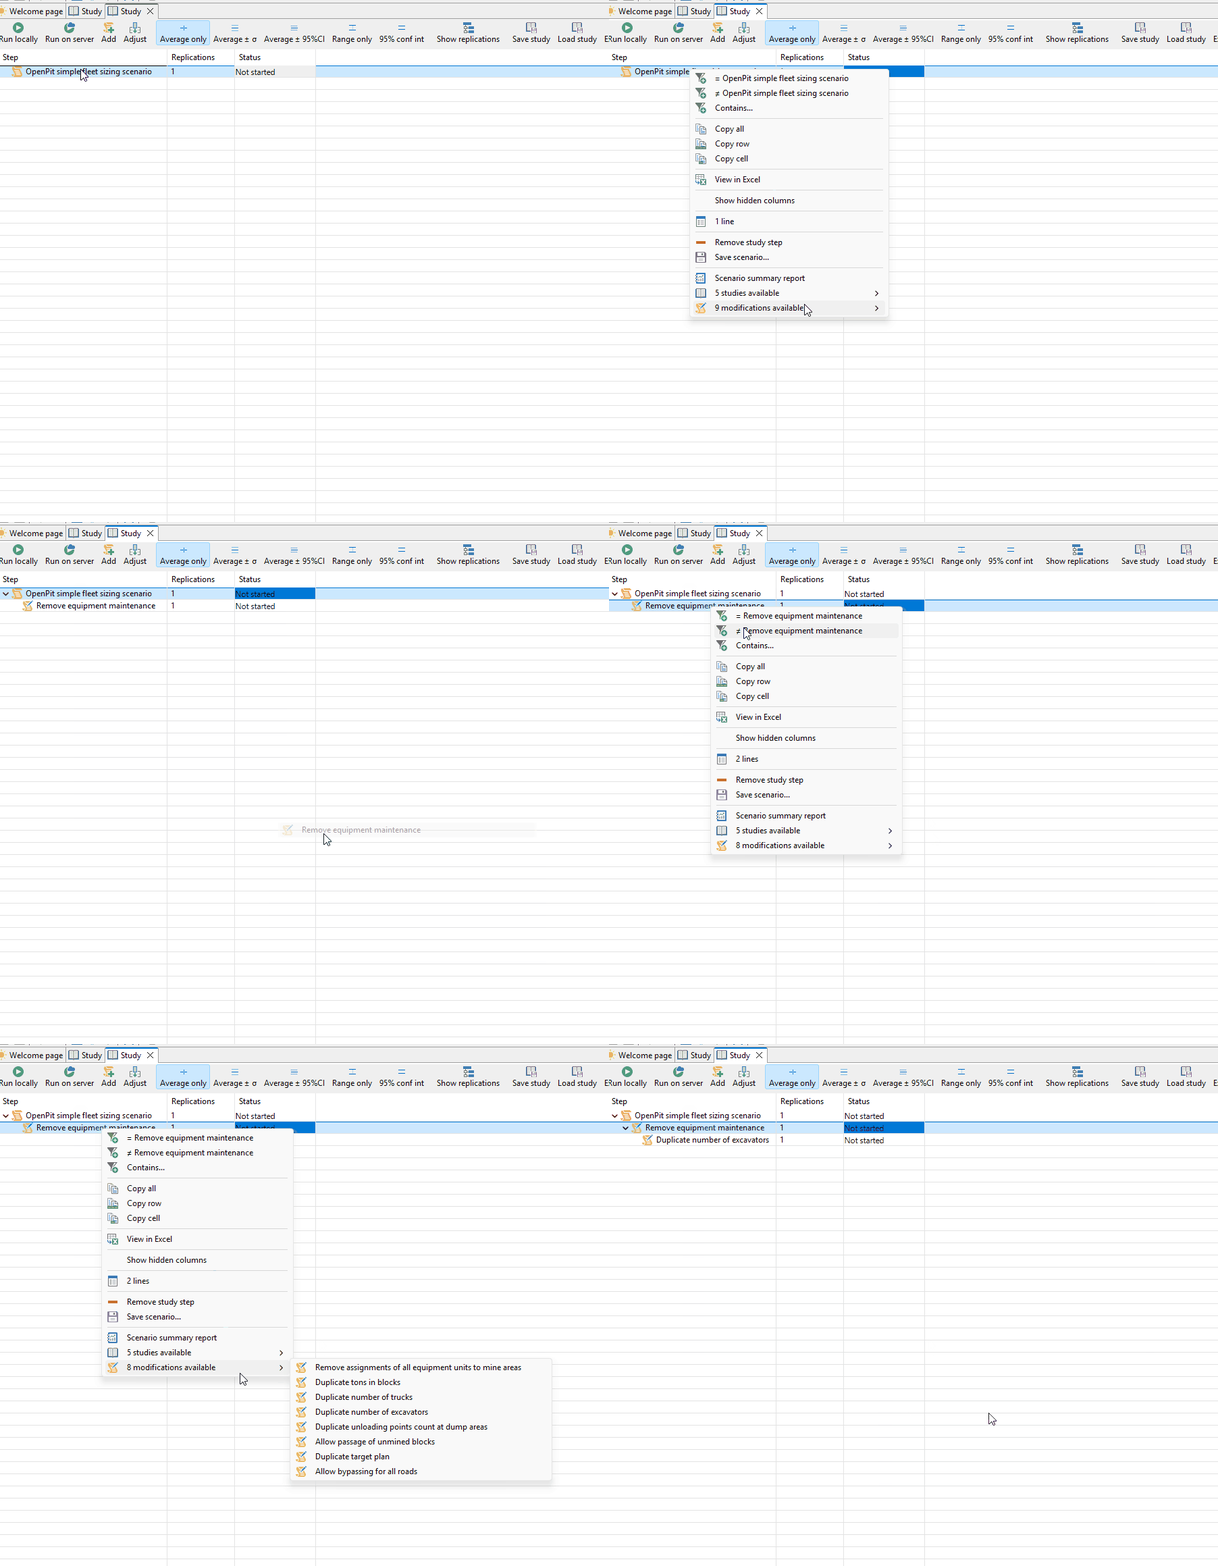
Any intermediate step can be used as the root step of a new study. This makes it possible to branch the analysis at the required moment and compare alternative scenarios.
Automated Study Modes
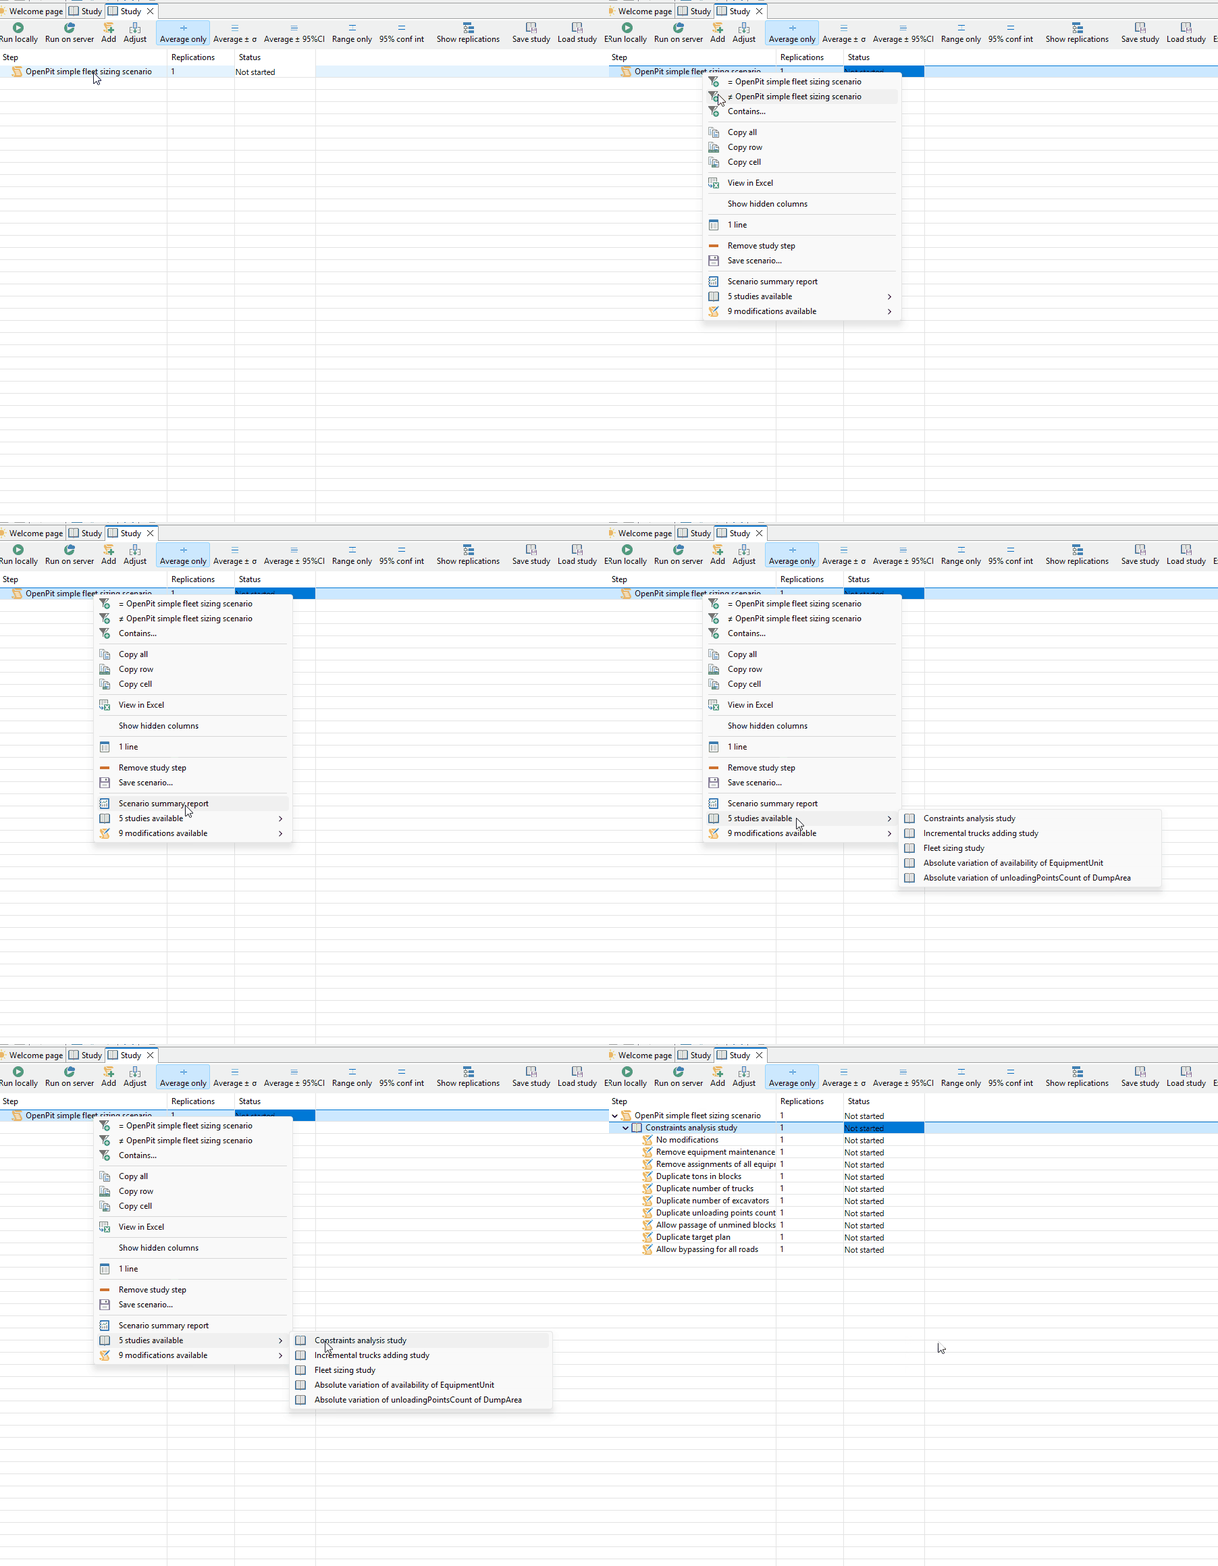
Instead of adding individual modifications, you can run one of the automated study modes.
The following automated studies are available:
-
Constraint Analysis
-
Fleet Sizing
-
Equipment Units Count Variation
The Constraint Analysis mode is intended to identify scenario bottlenecks. When this analysis is run, MineTwin automatically launches the scenario simulation multiple times with available modifications applied, removing each major constraint in turn, and shows how much the mining plan fulfillment percentage would improve if that constraint did not exist: Instead of adding individual modifications, you can launch one of the automated study modes.
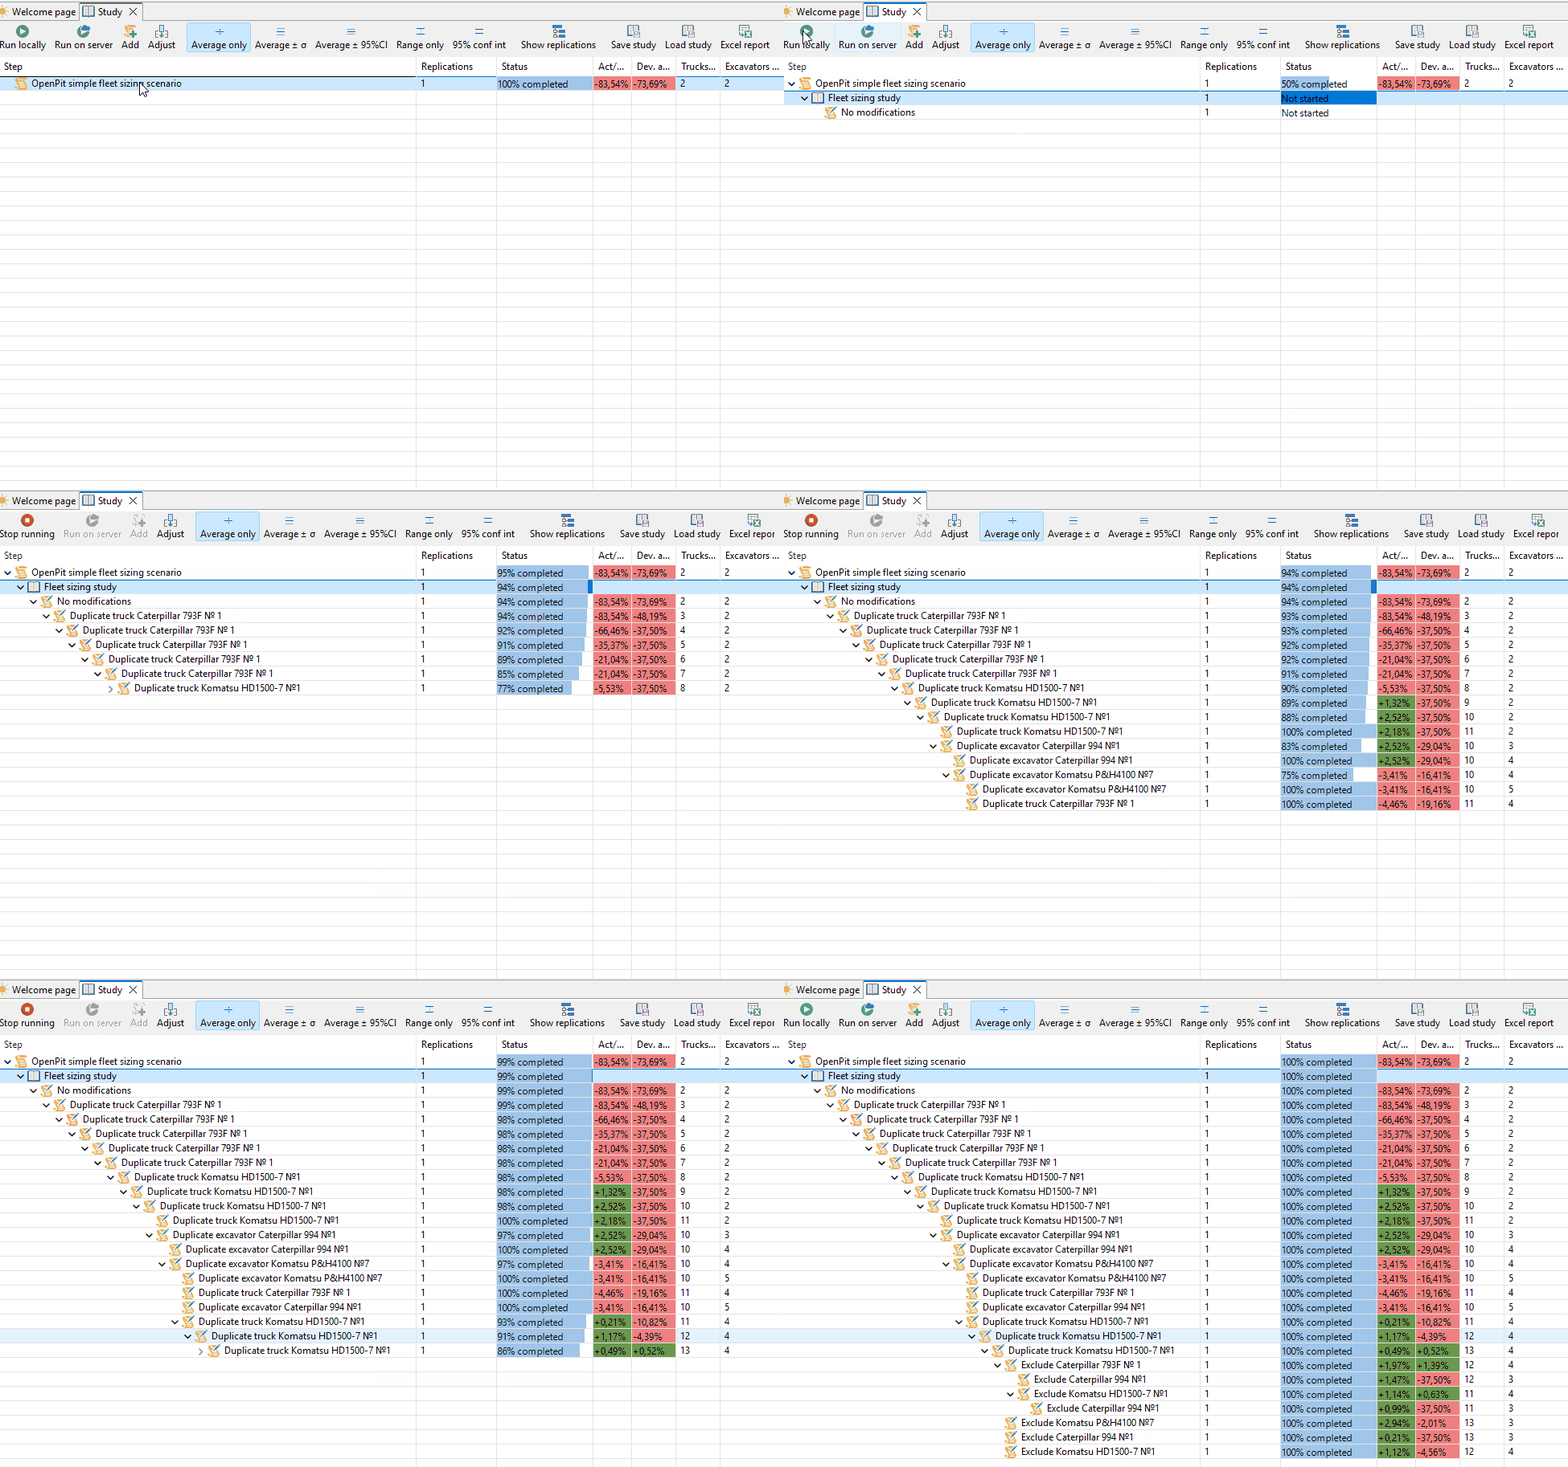
The Fleet Sizing study uses a sequential strategy to identify the minimum sufficient amount of equipment required to achieve the production target. During this study, instances of different equipment types are added or excluded step by step:
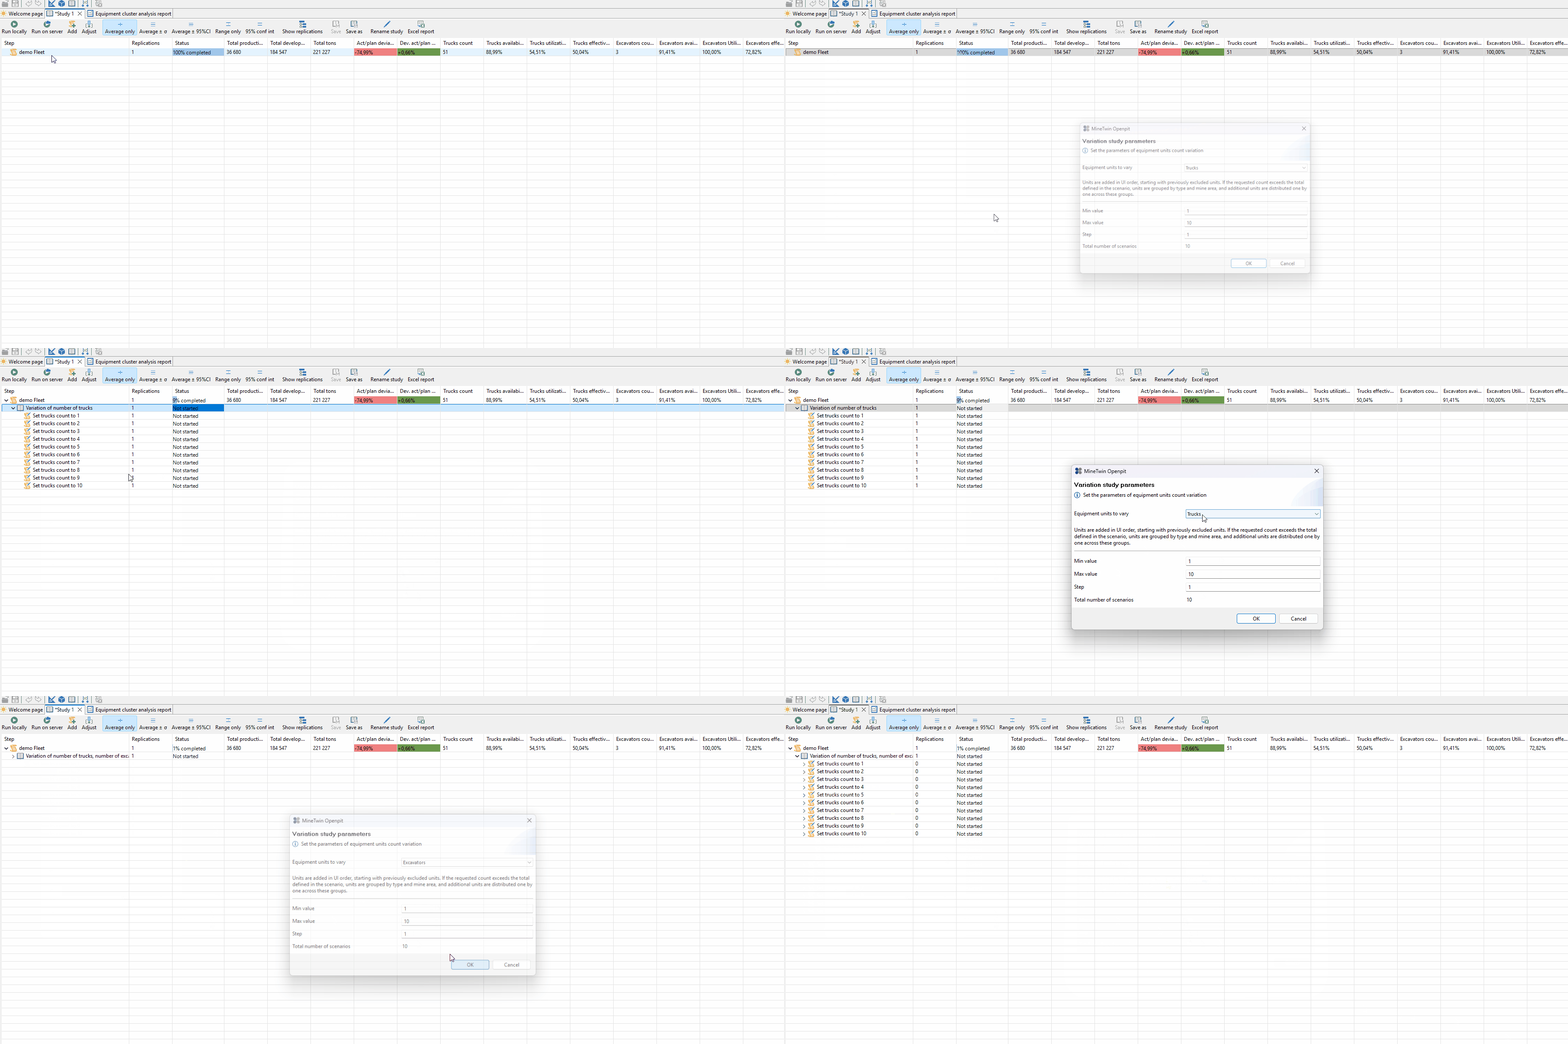
The Equipment Units Count Variation study allows users to configure and run one- and two-axis sensitivity analysis of a set of target KPIs against changes within a specified range in the amount of equipment and/or various operating parameters.
The following sections describe these modes in more detail.
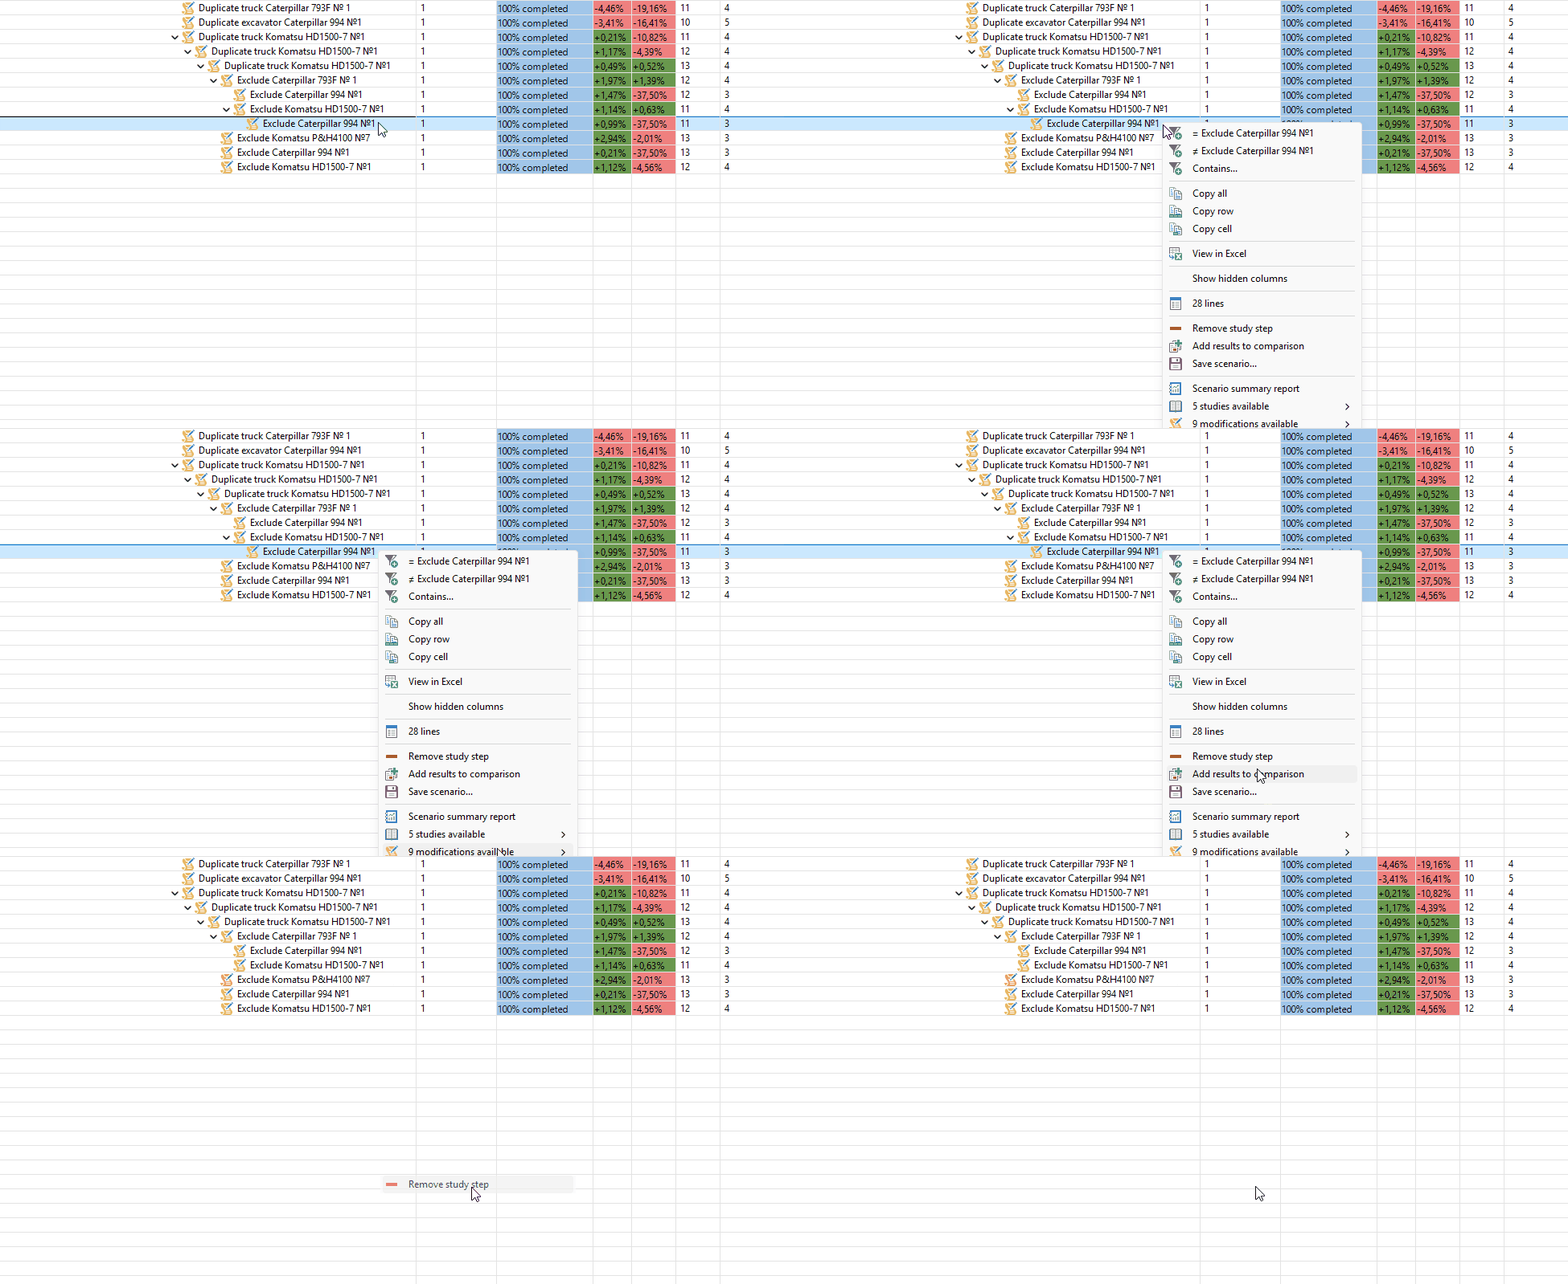
Any step can be deleted through the context menu or by pressing Delete on the keyboard:
Any step can also be saved as a separate scenario for later use.
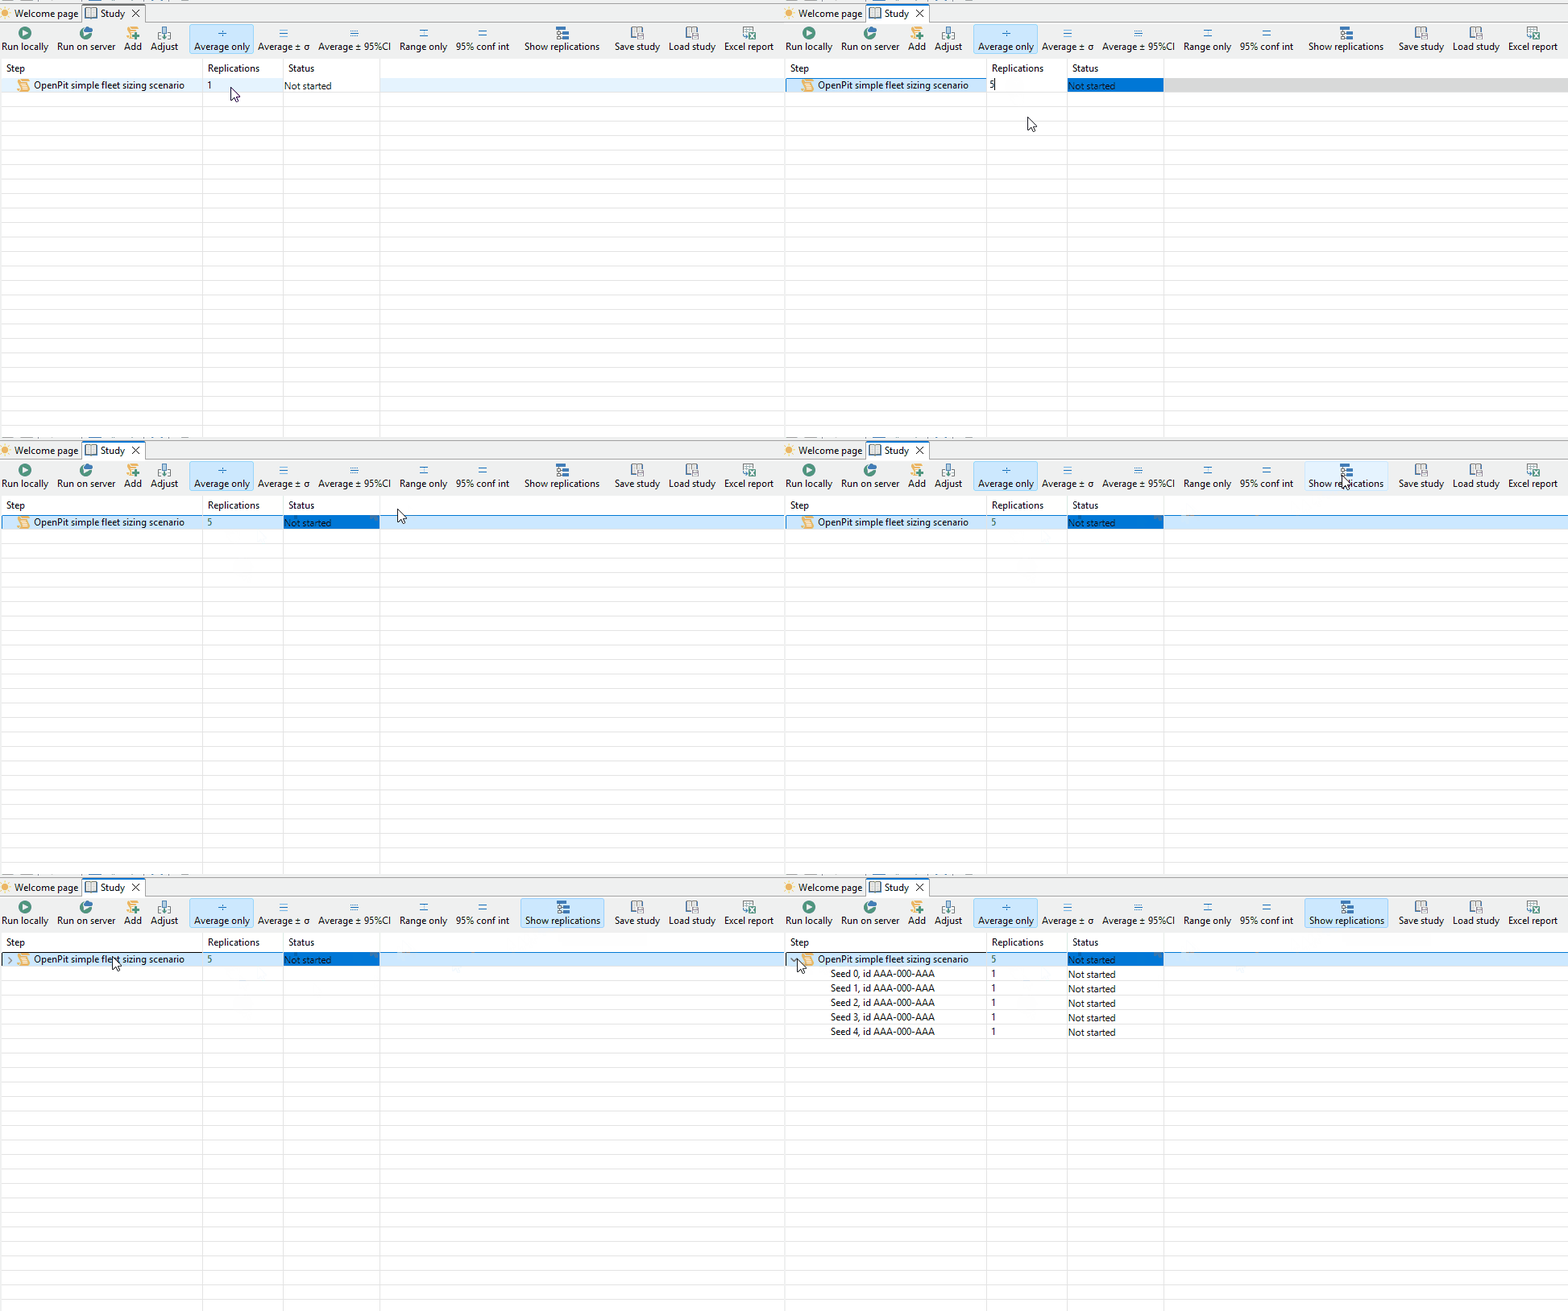
Setting the Number of Replications
-
Specify the number of replications (runs) for the selected step.
-
Each replication uses a different random number seed.
-
Enable Show replications to display individual run values.
Running Calculations
Choose how to run the calculations:

-
Run Locally — execution on the local machine
-
Run on Server — calculations on the MineTwin server
Server mode significantly reduces the load on the user’s computer when the workload is large.
-
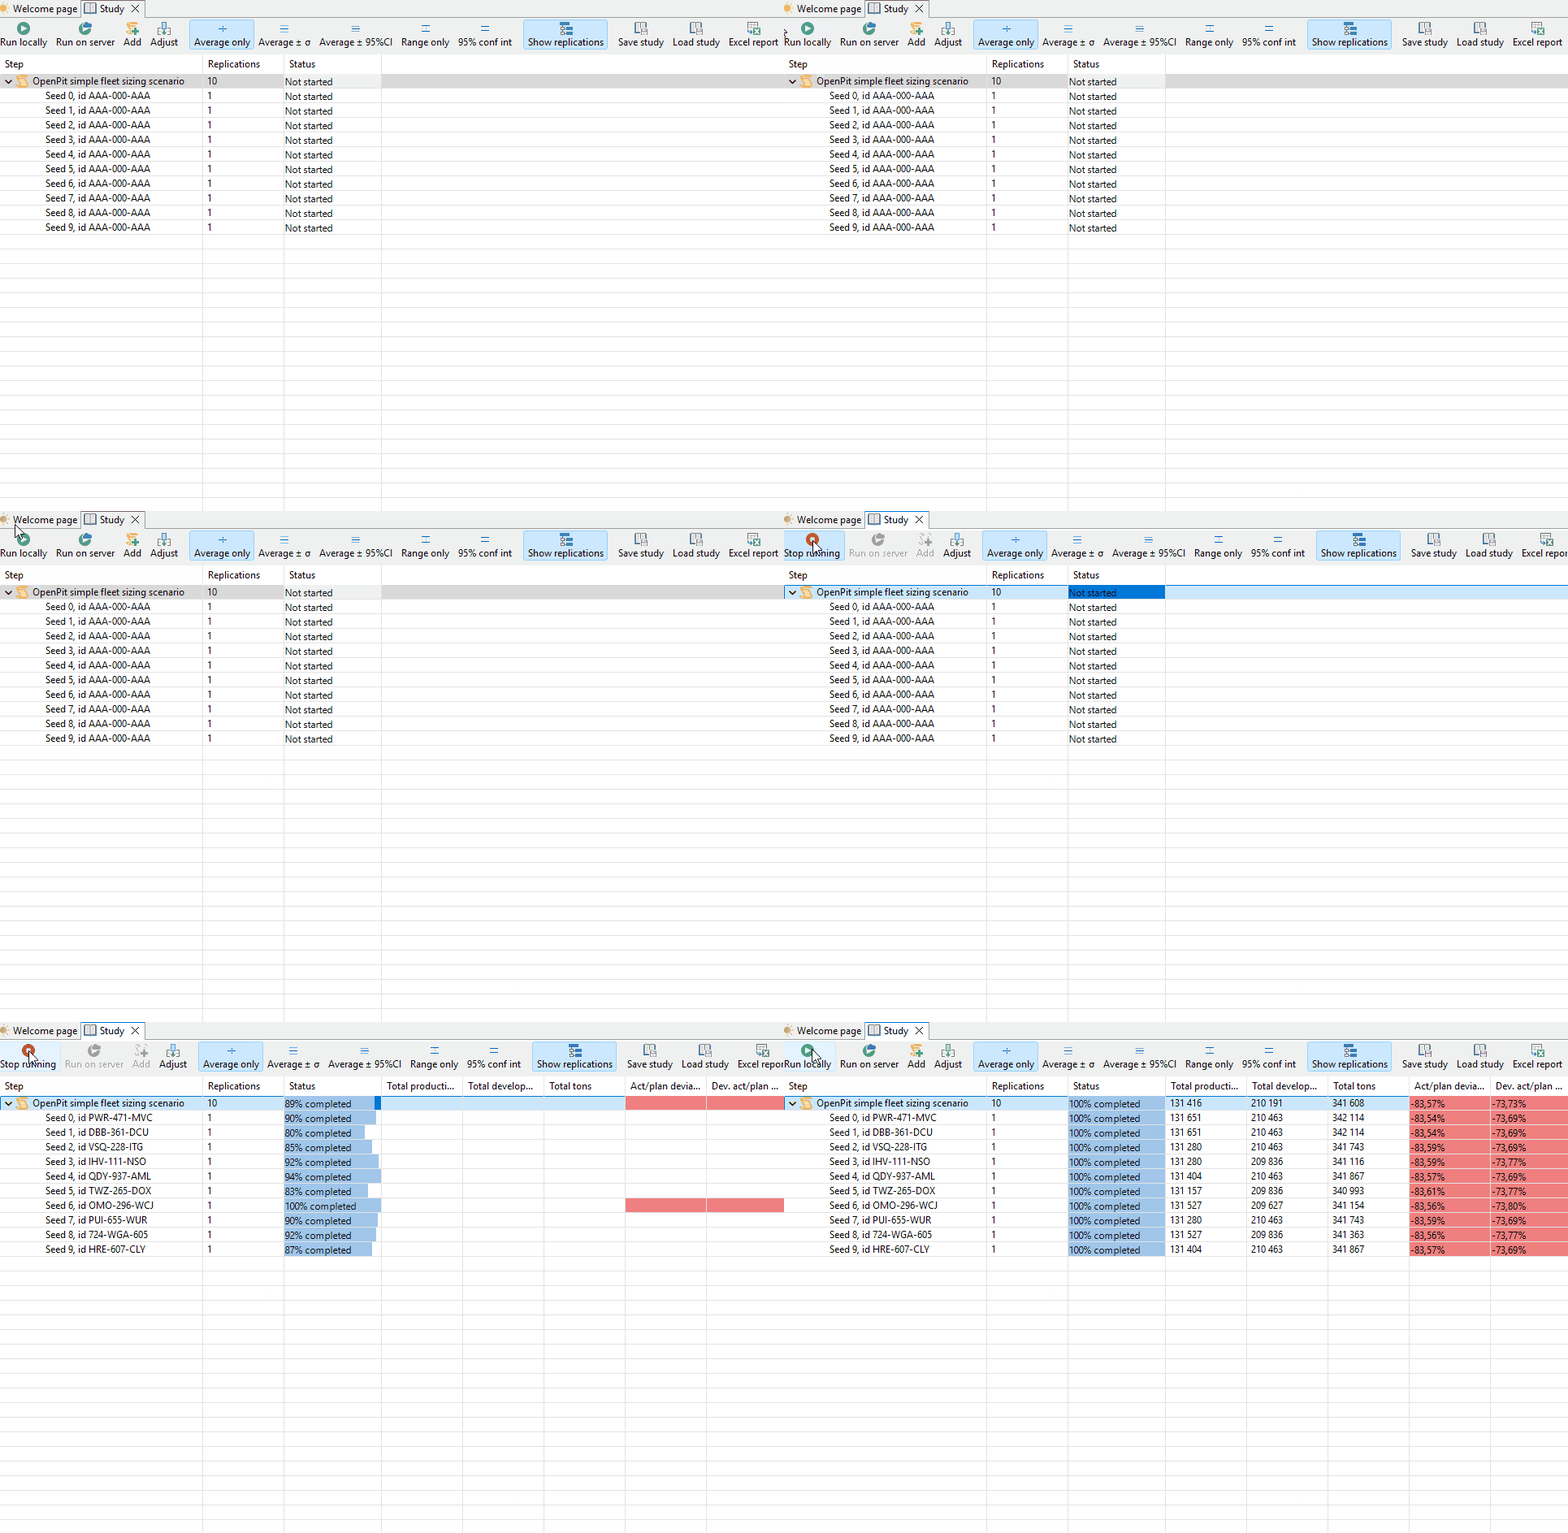
Click "Run locally" or "Run on server".
-
Track the execution status in the corresponding table column.
-
You can switch to another mode (for example, scenario editing) without waiting for the calculations to finish. They will continue in the background, and the results will be available when you return.
Any study can be saved and reopened later. If calculations are performed on the server, the study can be saved even before all step calculations are finished. After reopening, already calculated results will be automatically loaded from the server.

Viewing and Analyzing Results
Results appear in the study step table. To customize which data columns are displayed in the table, click the Adjust button on the toolbar:
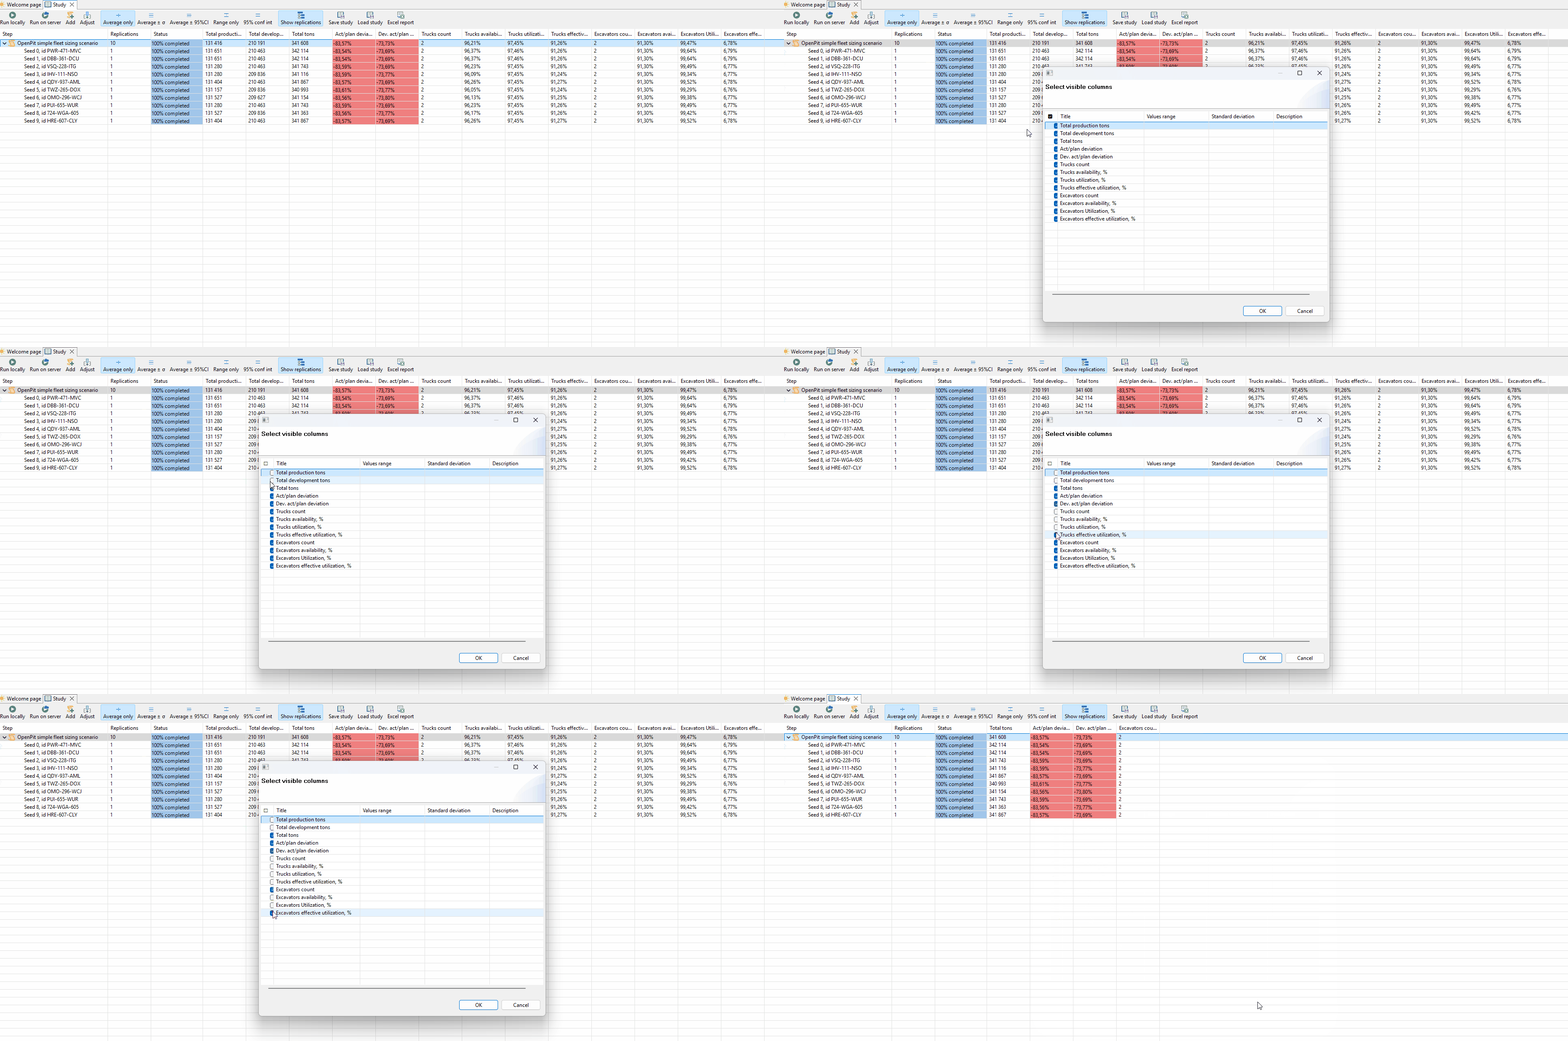
Data columns, including those added via the Adjust button, can be dragged by their headers to change their order.
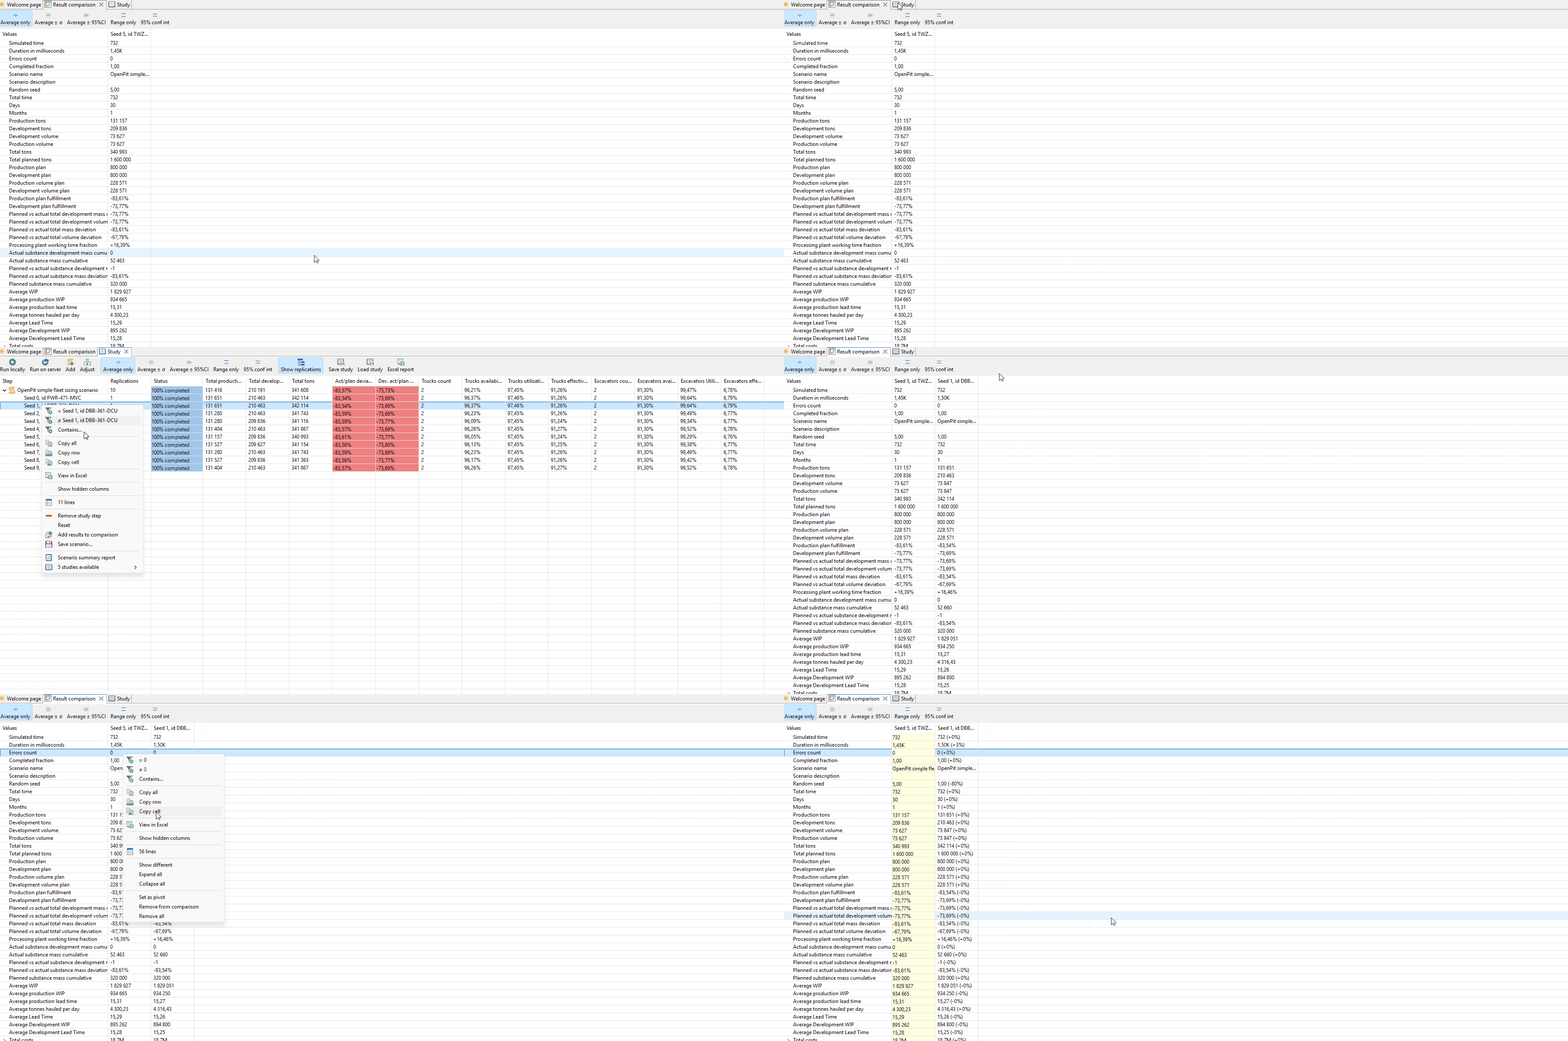
You can right-click any step and choose Show detailed results:
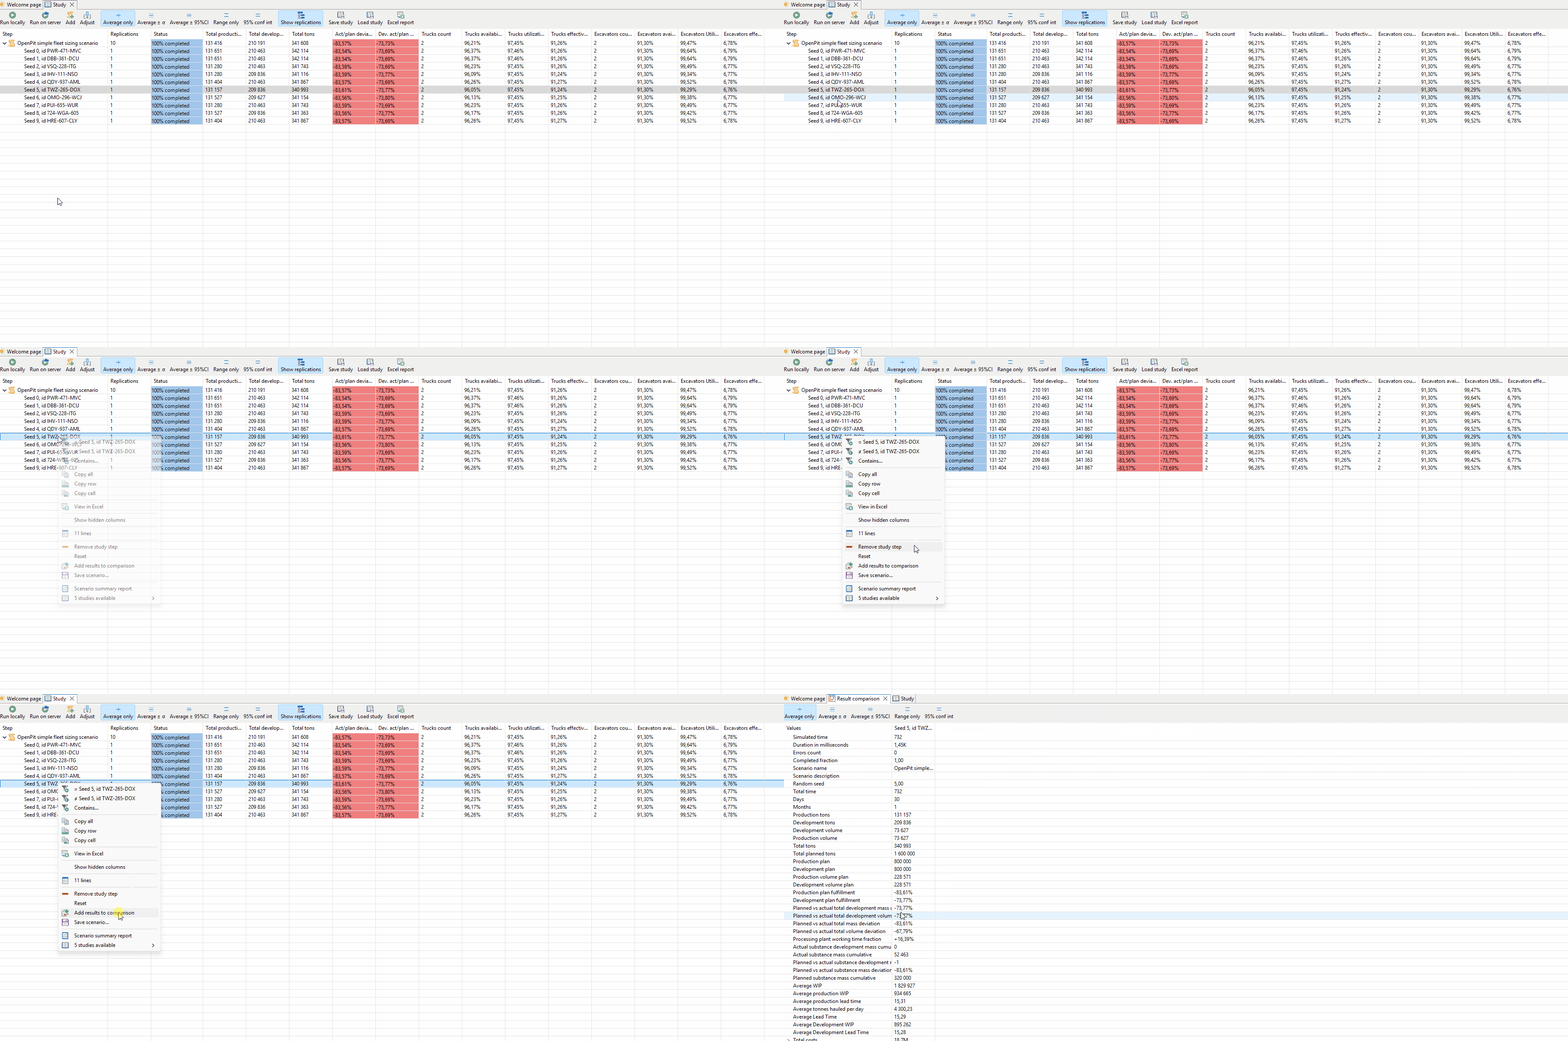
This opens the Result comparison tab with detailed metrics.
If a comparison tab already exists, use the command:
-
Add results to comparison.
You can add other scenarios to the comparison tab and set one as a baseline. Differences will be calculated automatically:
If your scenario contains several replications you can use the toolbar to toggle how result values are aggregated:
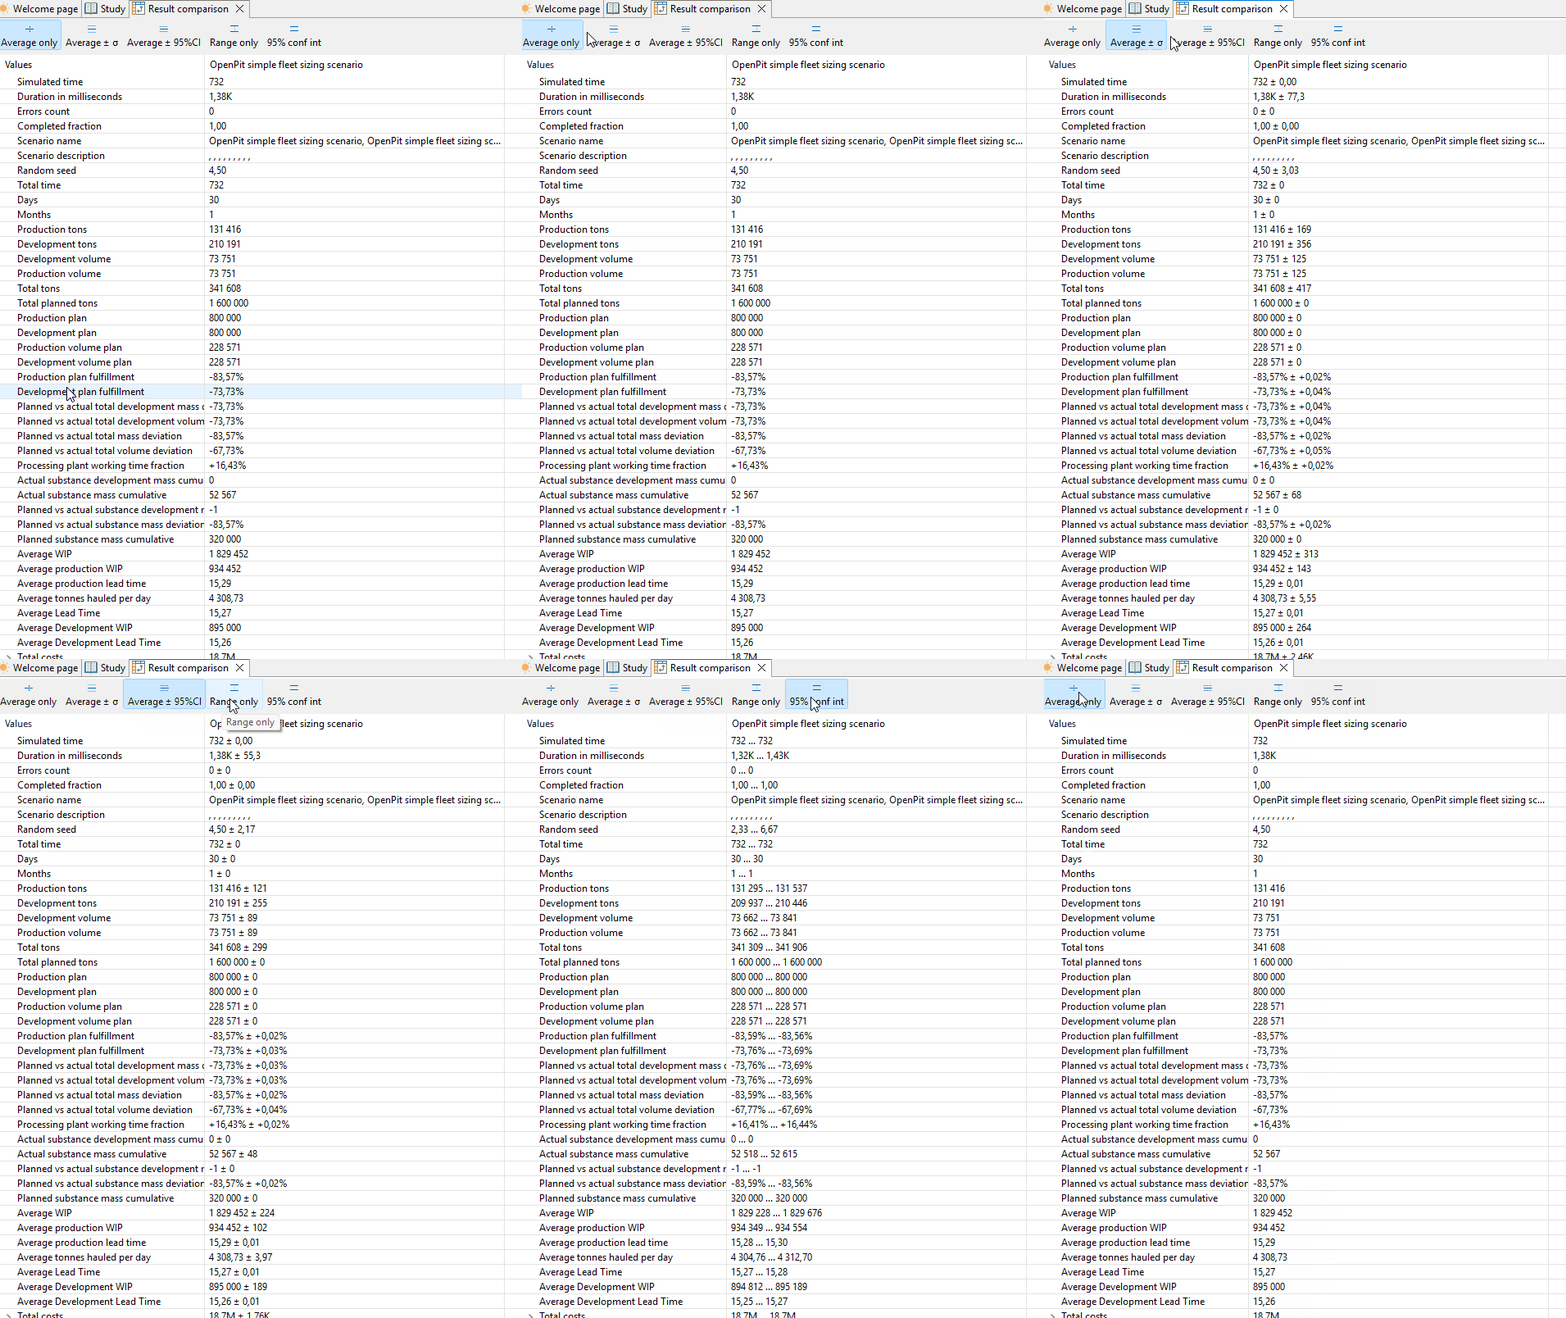
Available views:
-
Mean value only
-
Mean ± standard deviation
-
Mean ± 95% confidence interval
-
Value range only
-
Confidence interval bounds only
How the confidence interval works:
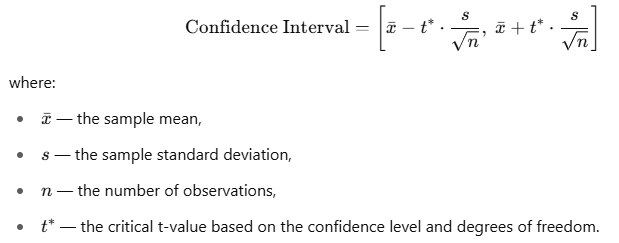
The confidence interval allows you to determine the range in which the true average value of a metric is likely to fall with 95% probability (confidence level), based on your sample data. The calculation uses a special statistical method called the t-distribution, which accounts for the sample size. This is particularly important when the number of observations is relatively small. The confidence interval is calculated using the following formula:
Reports
Each step supports a Scenario summary report, generated from the context menu:
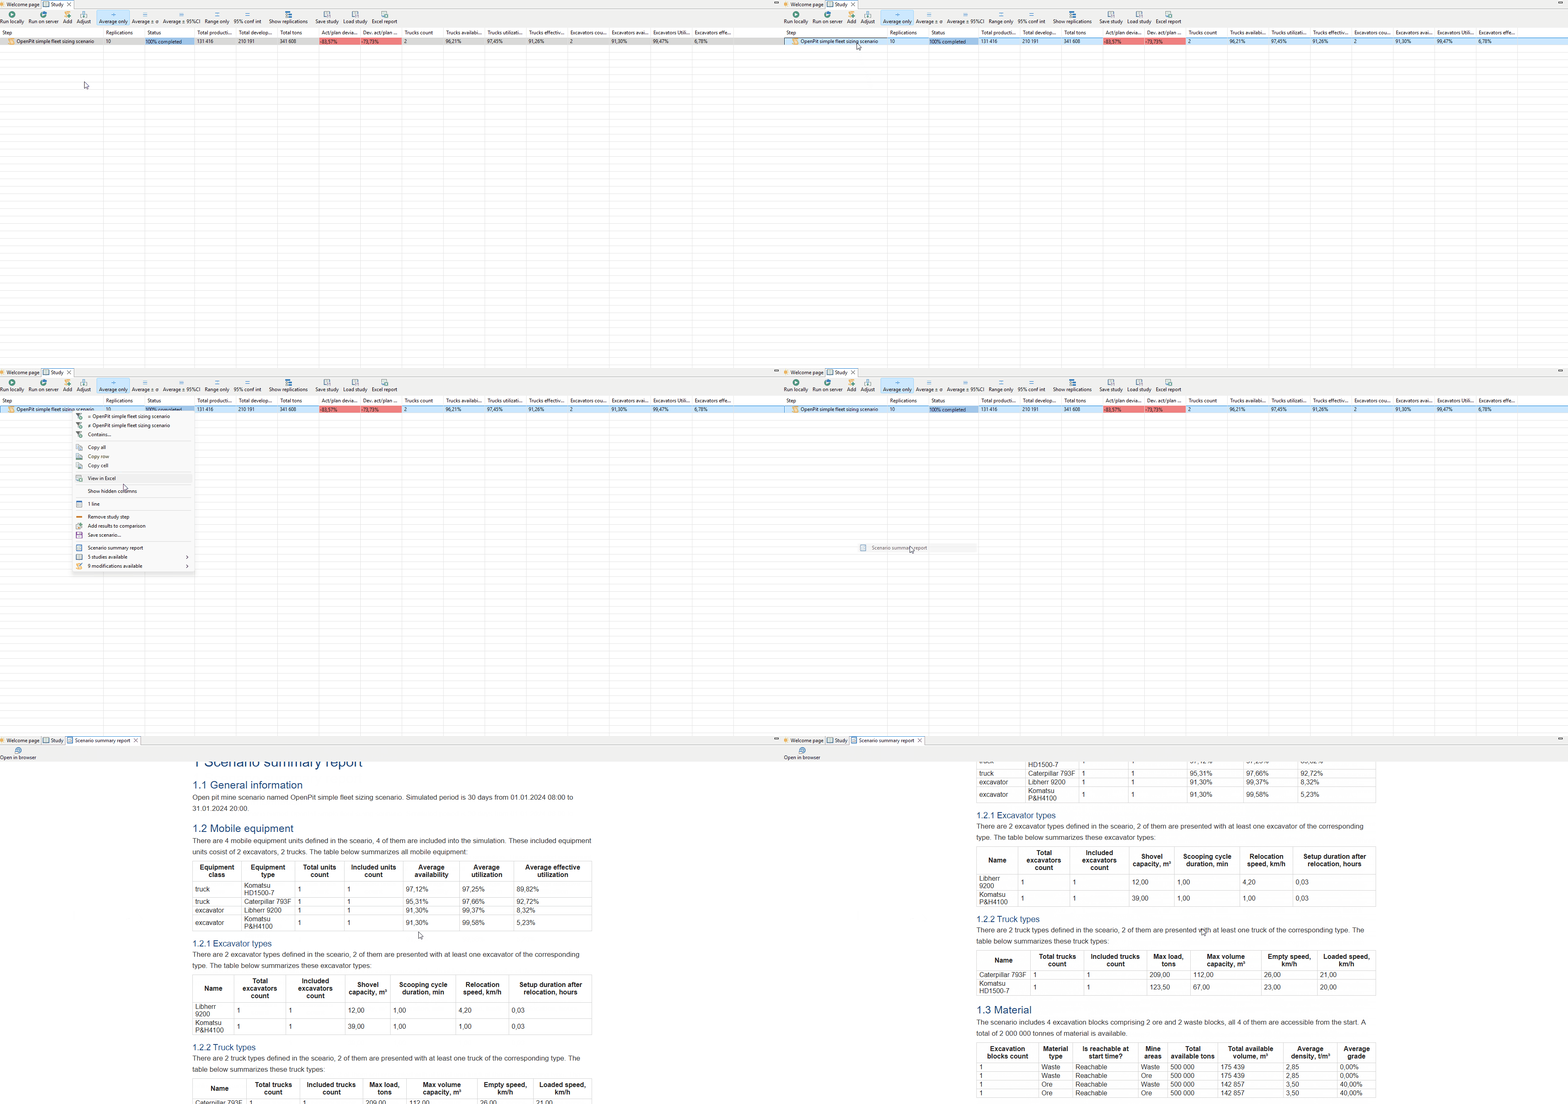
The report is generated as an HTML page and can be viewed in MineTwin. The report can also be opened in any browser (the Open in Browser button on the toolbar). This makes it possible to print it to PDF using browser tools.
Each automated study additionally generates its own report. To view it, select the corresponding item from the study context menu.
The study toolbar includes an Excel Report button.
When clicked, the study table is saved to an Excel file and immediately opened in the corresponding application.
Study Examples
Study: Constraint Analysis
Constraint analysis mode is intended to identify scenario bottlenecks. When the analysis is run, MineTwin automatically launches the scenario simulation multiple times, removing each major constraint in turn, and shows how much the mining plan fulfillment percentage would improve if that constraint did not exist.
Each constraint is modeled through a separate modification, and the results are compared with the baseline scenario. The visual representation makes it easy to identify the most critical bottlenecks.
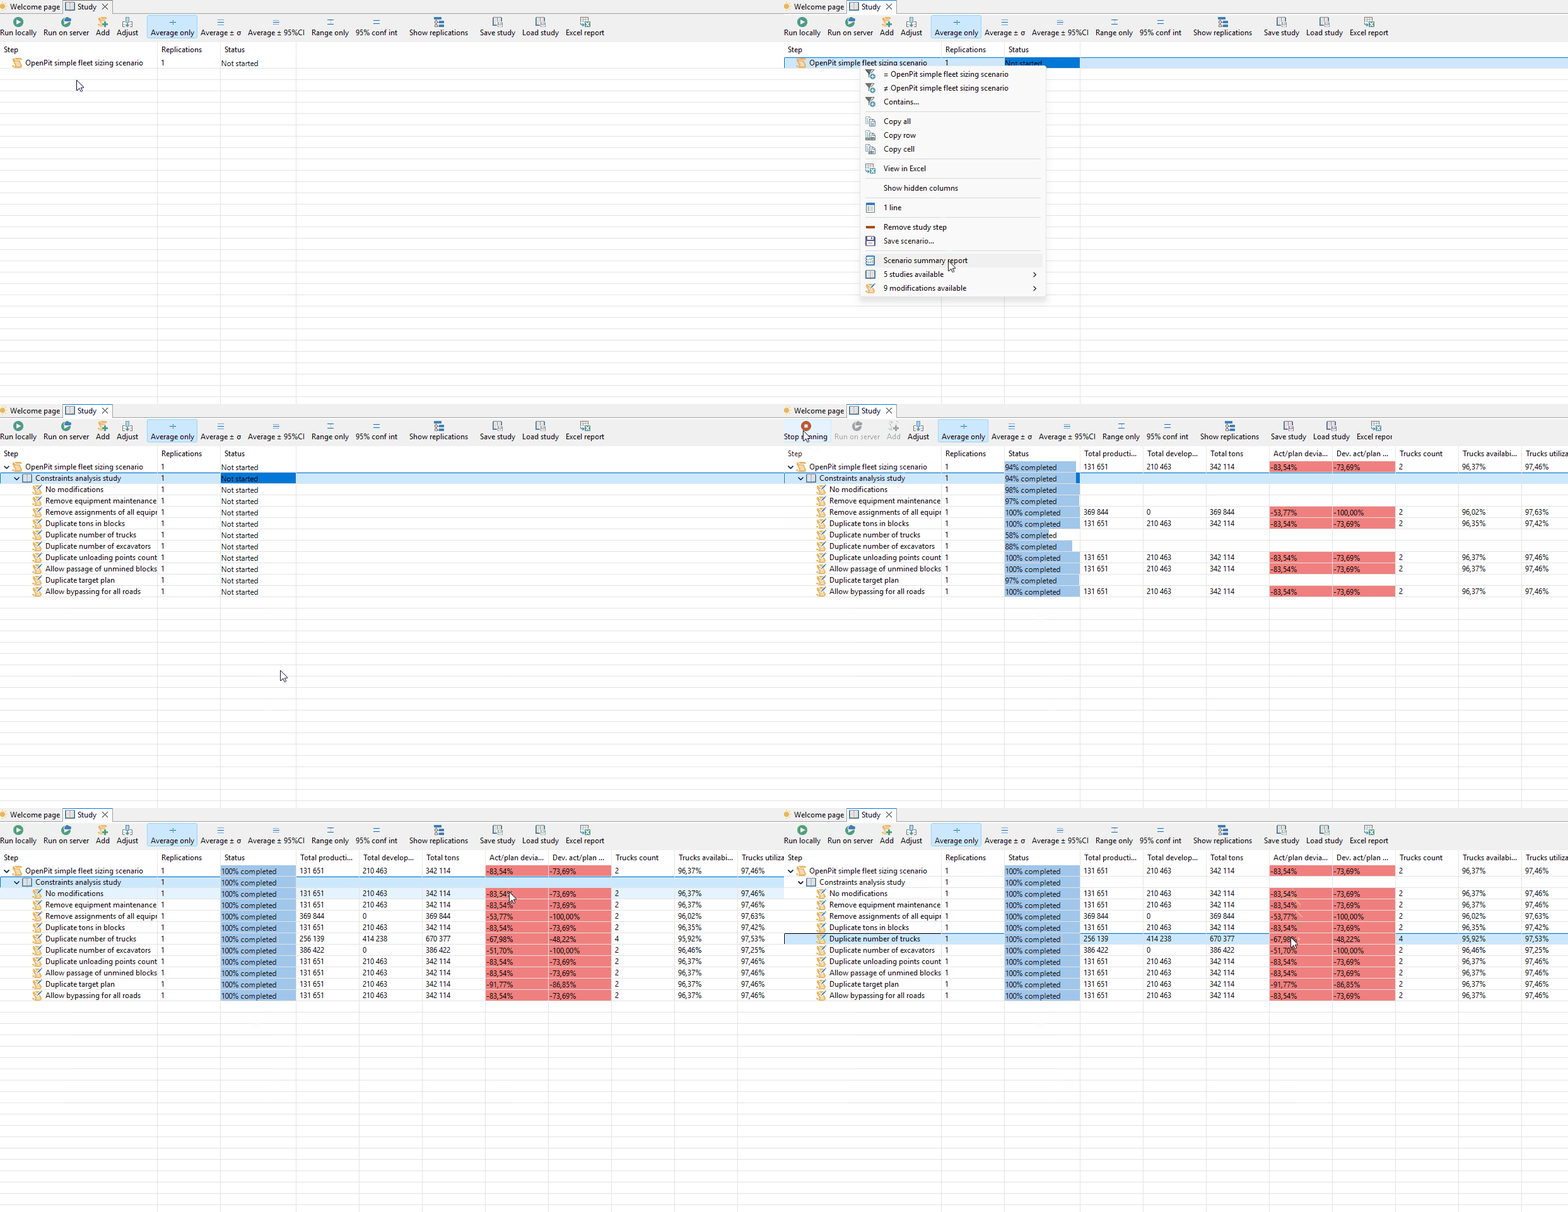
The following modifications are available:
-
Remove equipment maintenance;
-
Remove assignment of all equipment units to mine areas;
-
Duplicate tons in blocks;
-
Duplicate the number of trucks;
-
Duplicate the number of excavators;
-
Duplicate unloading points count at dump areas;
-
Allow passage of unmined blocks;
-
Duplicate target plan;
-
Allow bypassing for all roads.
The exact set of available modifications may vary depending on the software version.
A right-click command, Constraint Analysis Report, opens the HTML report in a separate tab.
The report contains:
-
a Methodology section describing the study methodology;
-
a Results section;
-
a table with the following columns:
-
Modification;
-
Total production and development tons mined;
-
Relative difference to the baseline scenario;
-
Modification description.
-
Such theoretical experiments help validate modeling assumptions. This Constraint analysis is typically the first step toward exploring real-world strategies for performance improvement. It provides a holistic view of system limitations and reveals complex interdependencies in mining operations.
Study: Fleet Sizing
This mode is designed to select the mobile equipment configuration minimally required to achieve the target production and development plans.
After launch:
-
the No Modifications scenario is calculated;
-
equipment clusters are identified — combinations of equipment class and type, as well as the areas to which they are assigned;
-
the first Equipment Cluster Analysis is performed;
-
within the cluster analysis, the following scenarios are created:
-
Duplicating equipment units in all clusters;
-
variations of this scenario where equipment is duplicated in all clusters except one;
-
-
the system determines which cluster increase gives the greatest effect;
-
calculates how many equipment units need to be added;
-
generates a new scenario with additional equipment;
-
then repeats the cluster analysis.
The cycle continues until a configuration is found that allows the plan to be fulfilled for both production and development mining.
After the plan is achieved, the stage of excluding the least utilized equipment units begins:
-
after each exclusion, a new scenario is generated;
-
if the plan is no longer fulfilled, that branch is discarded;
-
if the plan is still fulfilled, the study continues deeper into that branch with further equipment exclusions;
-
the process continues until a dead end is reached.
The entire process is displayed as a hierarchical table with branching study steps.
Each Equipment Cluster Analysis generates a separate HTML report. The report contains:
-
the baseline limiting plan fulfillment;
-
the theoretical maximum achieved by duplicating equipment in all clusters;
-
a list of clusters;
-
the number of units in each cluster;
-
an estimate of absolute improvement potential;
-
an estimate of improvement potential per unit;
-
a final recommendation for fleet changes.
The entire study for determining the optimal fleet size also generates a separate final HTML report.
The final report contains:
-
comparison of the Baseline Scenario and the Best Fleet Configuration;
-
target KPI achievement status;
-
Total tonnes mined;
-
Ore tonnes mined;
-
Development or waste tonnes mined;
-
Total cost;
-
Cost per ton;
-
Number of trucks;
-
Number of excavators;
-
waterfall charts showing the step-by-step effect of fleet changes on total mining volume and cost per ton.
Study: Equipment Units Count Variation
The Equipment Units Count Variation mode is intended to determine how changes in equipment quantity and/or operating parameter values affect a set of target KPIs.
The mode is launched from the context menu.
After launch, a dialog box opens where the following can be specified:
-
equipment to vary;
-
minimum quantity;
-
maximum quantity;
-
variation step.
The dialog also shows how many scenarios will be generated.
After clicking OK, the required scenarios are created automatically. This launch creates a one-axis study.
Variation axes are available for different types of equipment, including:
-
trucks;
-
excavators;
-
drills;
-
charging machines;
-
loaders; etc.
Adding a Second Variation Axis
To add a second and subsequent axes for another equipment type, right-click the study and select Add variation axis from the context menu. A dialog box similar to the one used for the one-axis study will appear.
To add a second axis for another parameter, or to create an axis for a parameter not related to equipment quantity, you need to:
-
switch to editor mode;
-
open the tab where the required parameter is located;
-
click the book icon button to the right of the parameter;
-
in the window that opens, specify the variation range and step;
-
choose whether to apply the changes to all equipment units or only to a specific unit;
-
if necessary, enable the flag to use the parameter as the second axis;
-
select from the dropdown list the existing one-axis study to which the new axis will be added.
Thus:
-
the first axis can be created via the Study mode as an equipment quantity study, or via the editor for varying parameter values not related to equipment quantity;
-
the second axis can be added from the Study mode for varying equipment quantity, or from the editor through object parameters for varying its value.
Reports for Variation Studies
Different HTML reports are generated for one-axis and two-axis studies.
The one-axis report contains:
-
description of the parameter under study;
-
total number of experiments and replications;
-
a correlation table with the following columns:
-
Independent parameter;
-
Dependent KPI;
-
Sufficient data;
-
Correlation type;
-
Spearman correlation coefficient;
-
-
textual conclusions on the identified relationships;
-
dependency charts for KPIs where correlation was found or its absence was confirmed.
The two-axis report contains:
-
description of the two varied parameters;
-
total number of experiments and replications;
-
tables and visualizations in the form of a heat map showing the influence of parameters on key KPIs.
The following are analyzed in two-axis reports:
-
Impact on total tons;
-
Impact on production tons;
-
Impact on production plan fulfillment;
-
Impact on trucks effective utilization;
-
Impact on excavators effective utilization.
Conclusion
The Study mode offers a powerful framework for evaluating operational strategies, identifying constraints, and making informed data-driven decisions.
By enabling structured experimentation and visual comparison of scenarios, Study mode transforms simulation into a practical decision-support tool. It helps engineers, analysts, and managers test assumptions, quantify outcomes, and prioritize actions that have the greatest operational and financial impact.
This not only accelerates the decision-making cycle but also improves confidence in strategic choices, ensuring that mine planning is based on evidence rather than intuition.
Summary of Key Workflows
The Study mode supports a range of structured workflows, including:
-
Creating studies from existing scenarios
-
Adding manual or automated modifications to explore operational changes
-
Running simulations locally or on the server, with background execution
-
Viewing individual or aggregated results, including statistical metrics
-
Comparing results across different steps or scenarios using baseline mode
-
Generating reports for each step or entire study
-
Saving any step as a reusable scenario or continuing analysis from any step
These workflows are designed to maximize analytical flexibility while reducing manual overhead.