Evaluate the impact of equipment availability
In this section, we will show how to use MineTwin to study the impact of equipment availability on mining volumes. We will start with the scenario we developed in one of the previous tutorials.
1. Create the baseline scenario
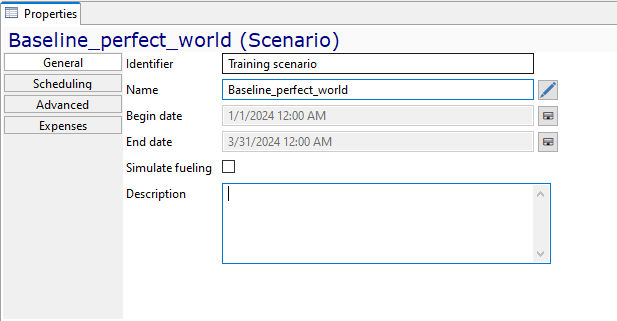
Let us first create a baseline scenario from scenario, which we developed in one of the previous tutorials. To do this, open this scenario in MineTwin, and just save it with the different file name: Baseline_perfect_world.xlsx. Note how after such saving, the name of the scenario automatically changes to the file name:
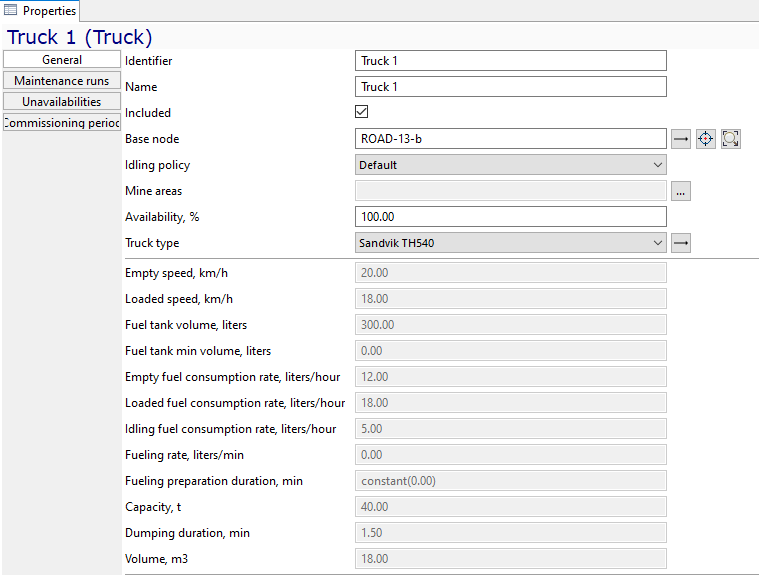
In this perfect world scenario, all our equipment units have 100% availability. See, for example, truck:
Here is the baseline scenario that we created.
2. Create scenarios with reduced availability
Now, let us use the baseline scenario we have just created to create 2 scenarios with reduced availability:
-
scenario with 90% availability for all equipment units
-
scenario with 80% availability for all equipment units
To create a 90% availability scenario:
-
Open the baseline scenario
-
Click Trucks tree item in the scenario tree view
-
Navigate to Properties page of a single truck
-
Set its availability percentage to 90
-
Repeat the same setting for Drill, Loader, and Charger
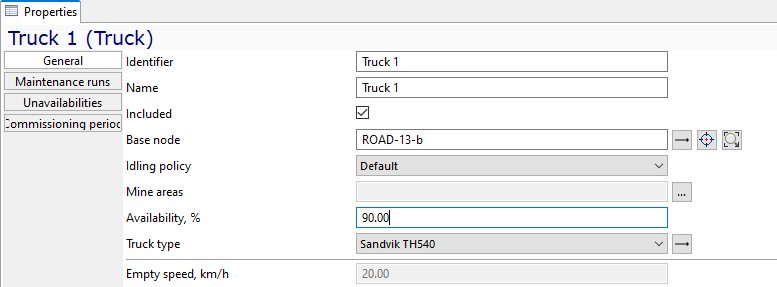
Save the scenario as a new file with the name Baseline_90_availability.xlsx.
Do the same changes once again to create a scenario with 80% availability of all 4 equipment units. So, we have created the 3 scenario files that are only different in equipment availability:
Please save these 3 files in the same folder on your machine so that it is easier to use MineTwin’s scenario comparison mode.
3. Compare the scenarios
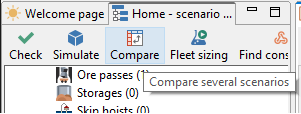
MineTwin has a scenario comparison mode that allows users to compare scenarios. Let’s see how to use this mode to compare our 3 scenarios with different equipment availability. Click the Compare button to switch to the scenario comparison mode:
Click the Add button and select our 3 scenario files in the standard dialog of your operating system. Below is the picture of how it is done on Windows OS:
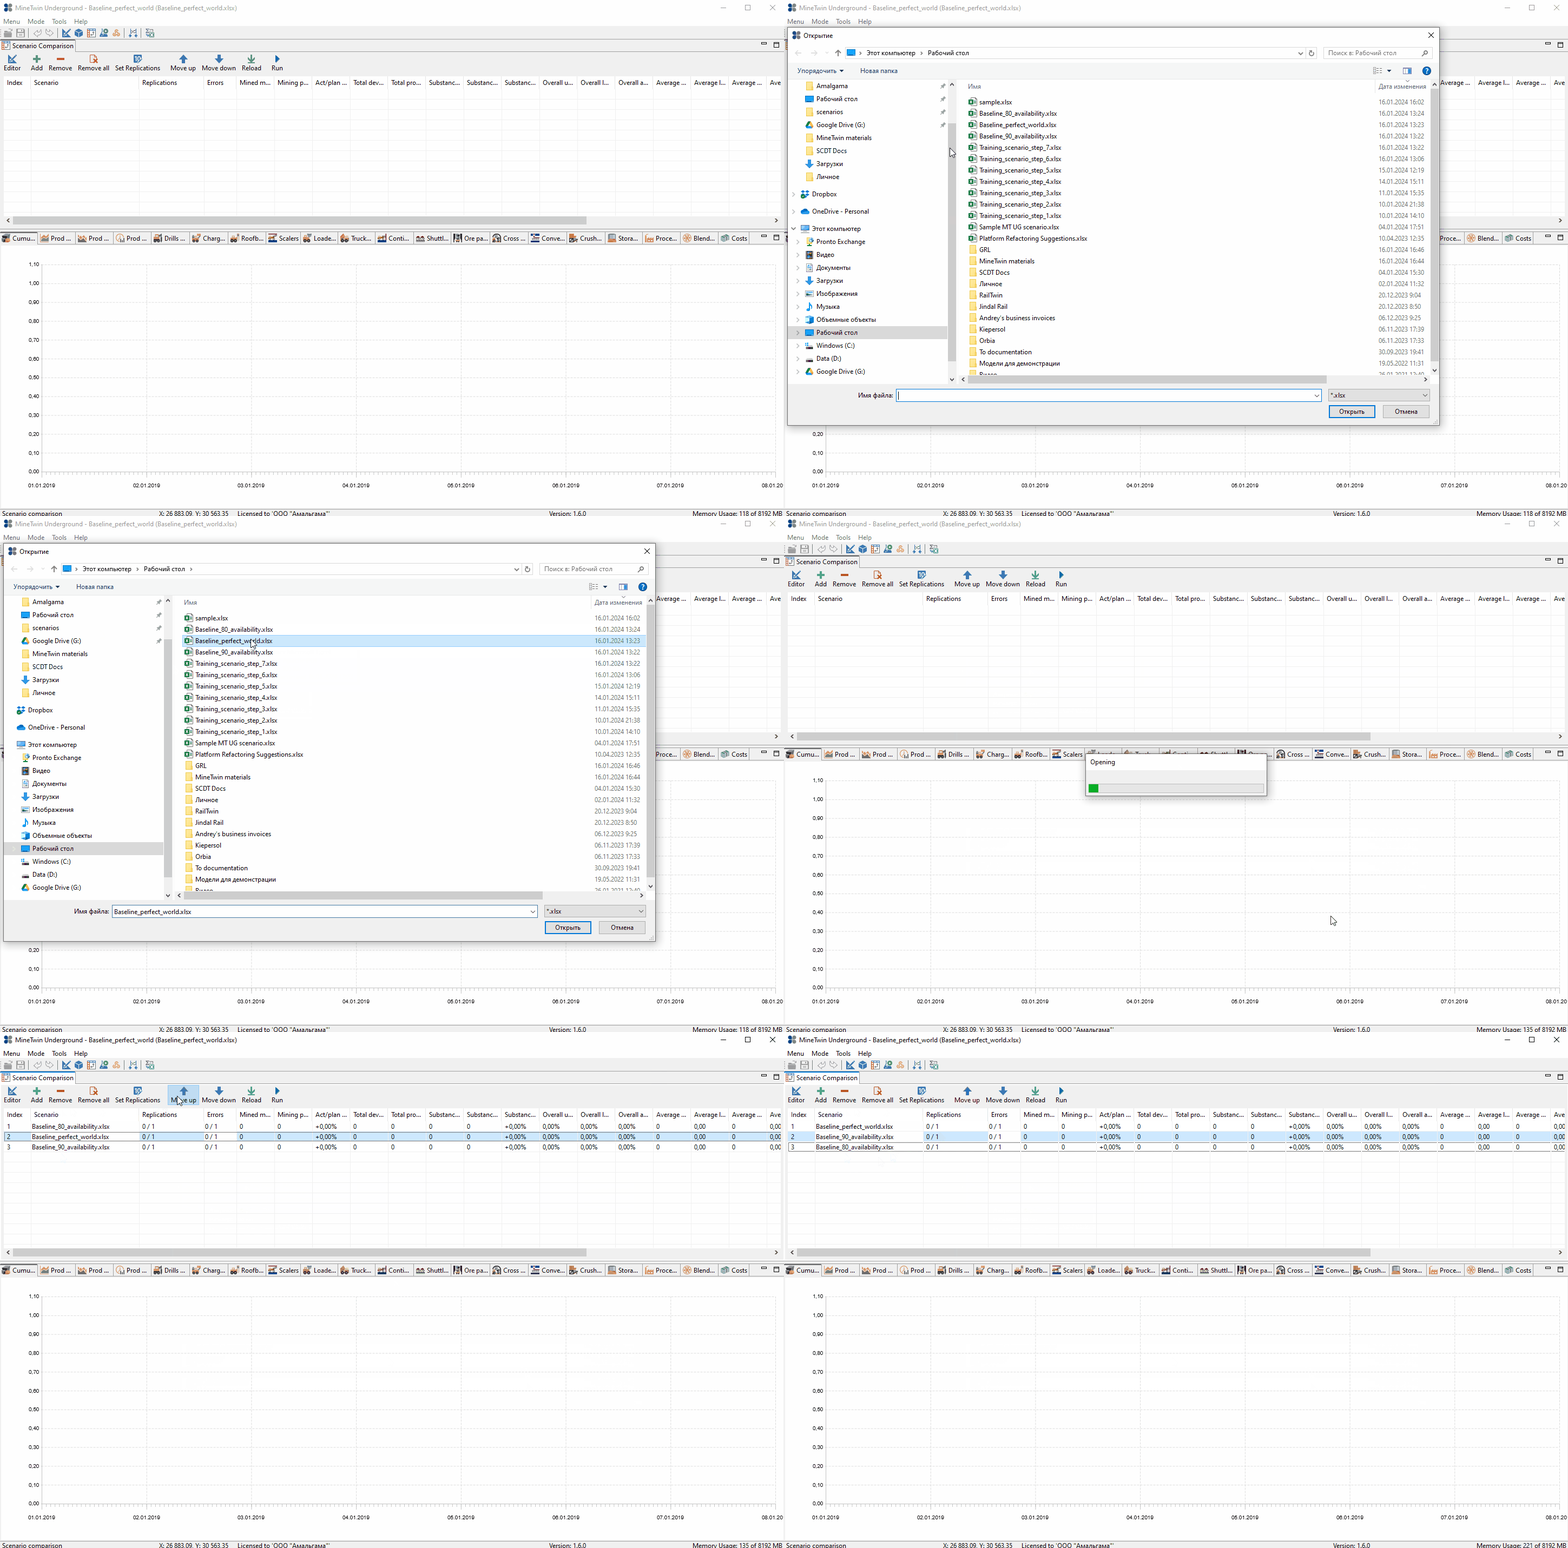
Note that the order of the files can be arbitrary, so you can use the Move Up and Move Down buttons. To organize the scenarios in some logical order. In our case, we sort them by availability in descending order.
Reduced availability is modeled by adding random off-schedule periods for the equipment units. As we now have sources of randomness in our simulation, we might want to set the replications with different random seeds. In MineTwin, we can do so by clicking the Set Replications button and setting the number of replications:
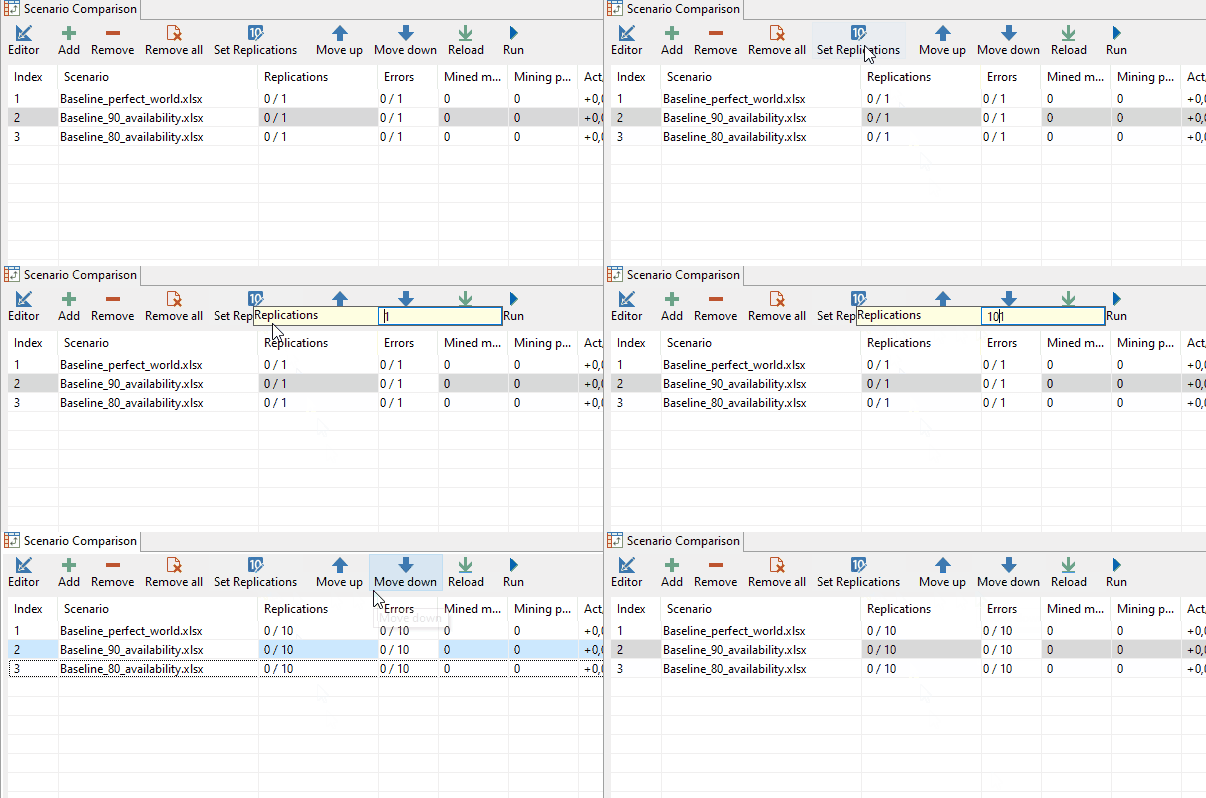
In our case, let us set 10 replications.
Now, we are all set to run the comparison of our scenarios. To do so, click the Run button and wait until running the experiments completes:

After it is completed, the results can be compared on the Cumulative mined mass plot shown below:

4. Export the results to Excel
So far, so good, but we might want to do some custom plots or further data analysis of our experiment.
We have two options to get the data from MineTwin into Excel for custom analysis.
Option 1
Every table inside MineTwin provides the functionality to export the data from the table to Excel. Right-click on any place of a table and select the View in Excel menu item. Excel or any other spreadsheet editor will open automatically. The data from the table will be exported to this spreadsheet:

Here is the resulting spreadsheet of the export.
Option 2
At the end of every simulation run, you can export more detailed results by using the Export results to Excel functionality.
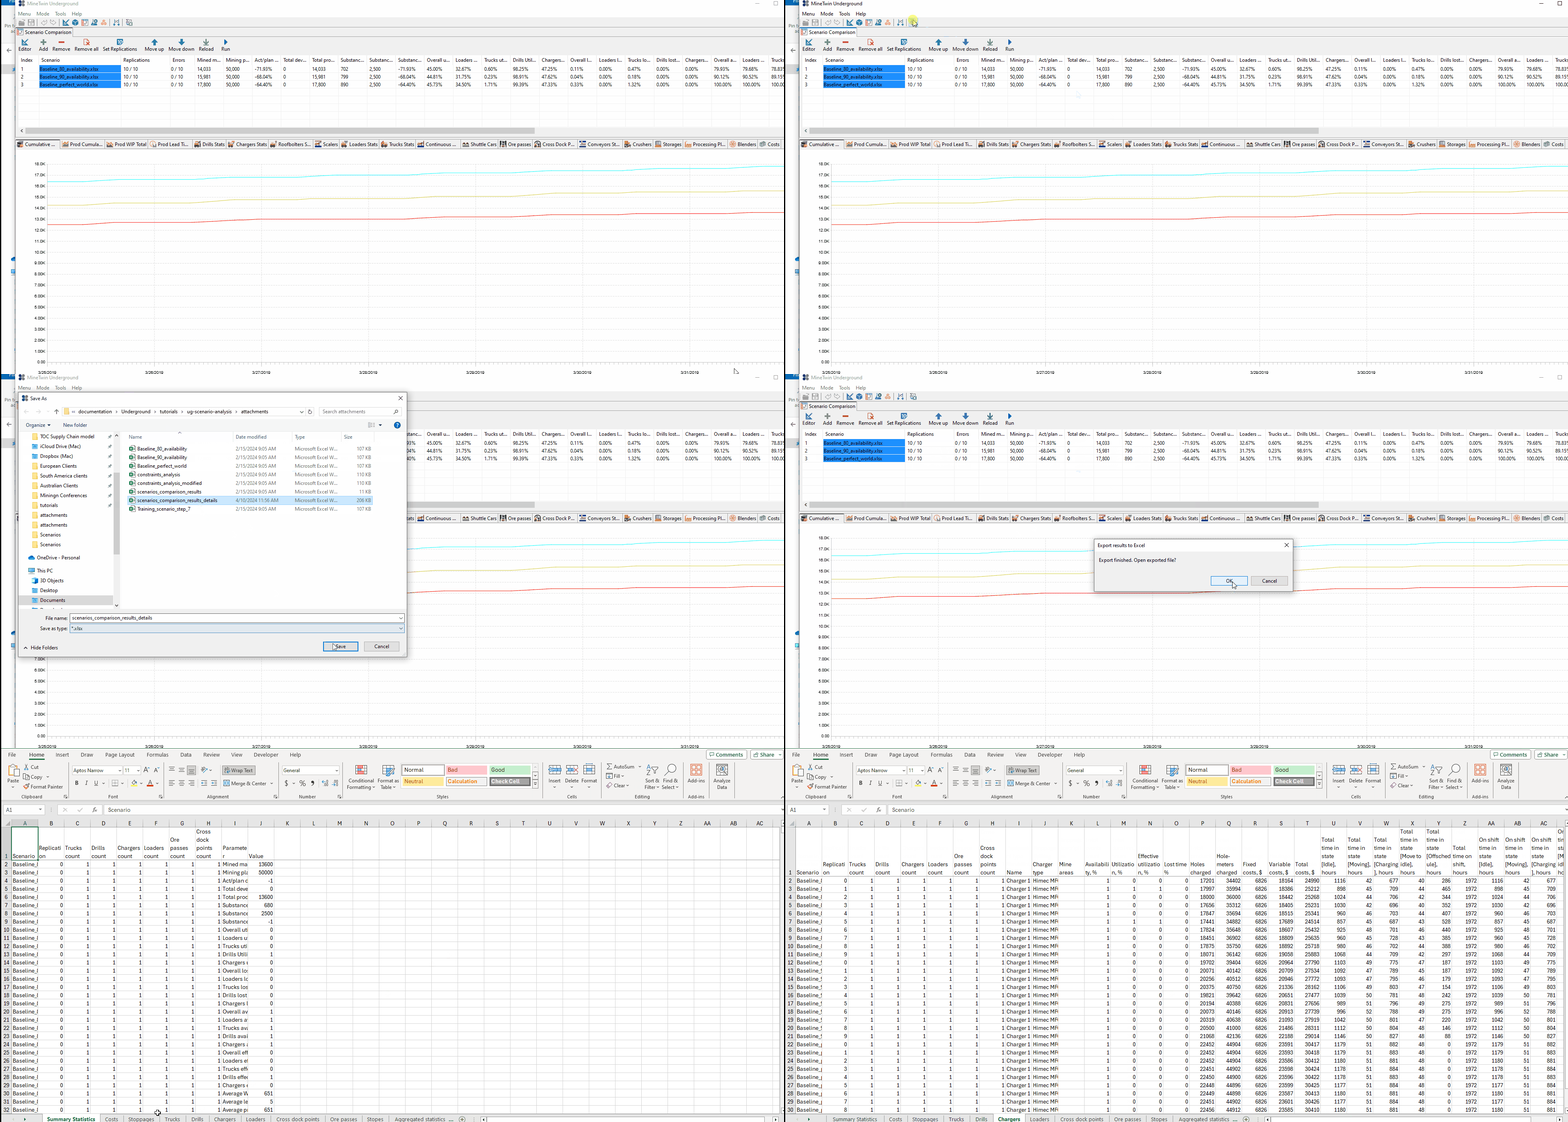
Here is the resulting spreadsheet of the export.
If you want to learn more about the scenario comparison functionality, view our YouTube video here. If the scenarios you want to compare only differ in terms of fleet sizes, MineTwin has an automated sensitivity analysis for fleet sizing called Fleet Sizing Experiment. You can view the video about that here.